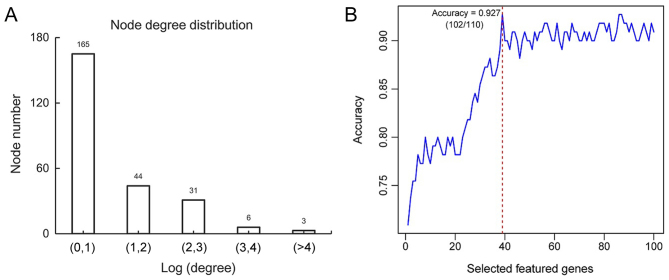
Figure 4.
Distribution of the node degree of interaction and the screening of feature genes following recursive feature elimination. (A) 165 genes exhibited a small degree score. The X-axis represents the value of Log (degree of interaction) and the Y-axis represents the number of nodes in the protein-protein interaction network. (B) The accuracy is highest when the number of feature genes is 39. The X-axis indicates number of feature genes and the Y-axis represents prediction accuracy.

