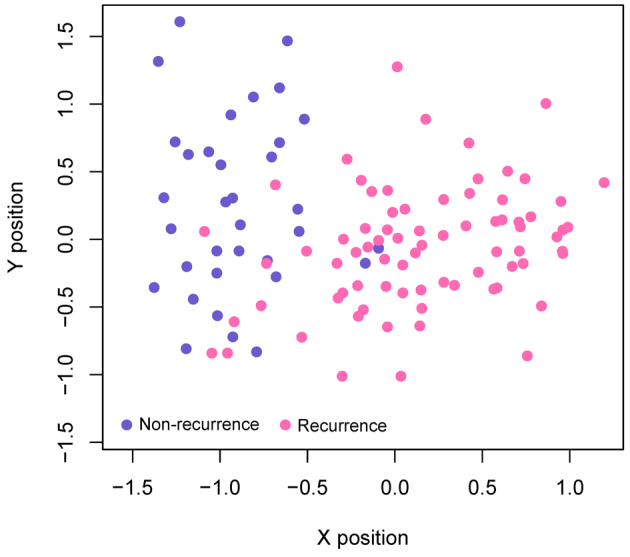
Figure 5.

Scatter plots detailing the prediction results of GSE17260 datasets using the support vector machine classifier. Blue dots represent samples from patients with non-recurrent OC and pink dots represent samples from patients with recurrent OC. OC, ovarian cancer.
