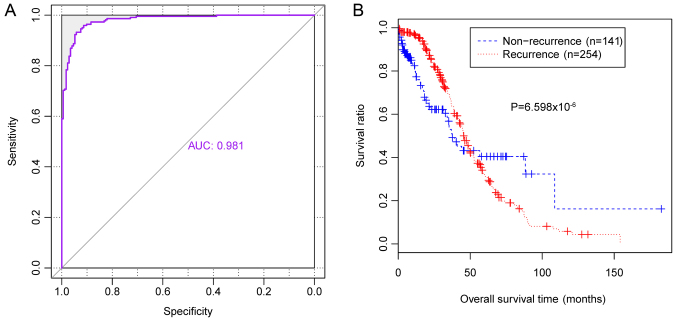
Figure 6.
Classification efficacy of the SVM classifier using independent gene expression data from the TCGA database. (A) Receiver operating characteristic curves and (B) Kaplan-Meier survival analysis predicted by the SVM classifier for using gene expression data from the TCGA database. The blue line indicates samples from patients with non-recurrent OC and the red line indicates samples from patients with recurrent OC. TCGA, the Cancer Genome Atlas; OC, ovarian cancer; AUC, area under a curve.

