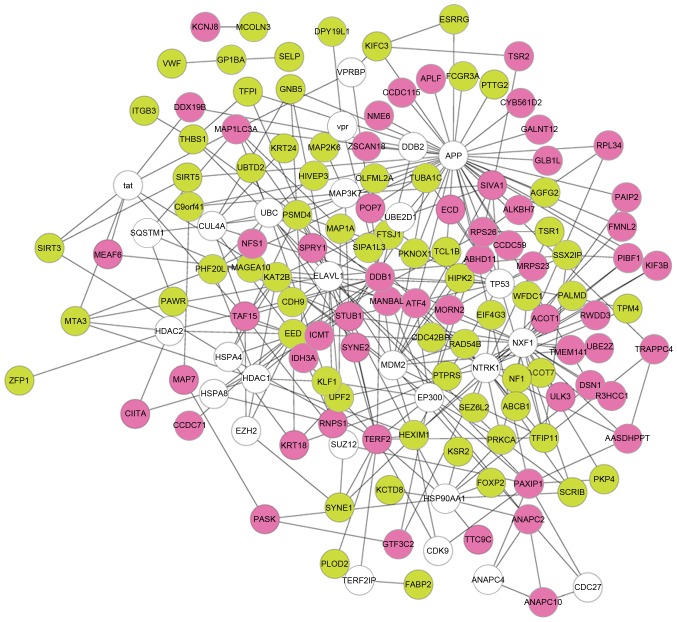
Figure 2.
PPI network constructed for the DEGs. Pink and green nodes separately represent upregulated and downregulated genes, respectively. White nodes stand for the non-DEGs which interacted with ≥10 DEGs and were expanded into the PPI network. PPI, protein-protein interaction; DEG, differentially expressed gene.

