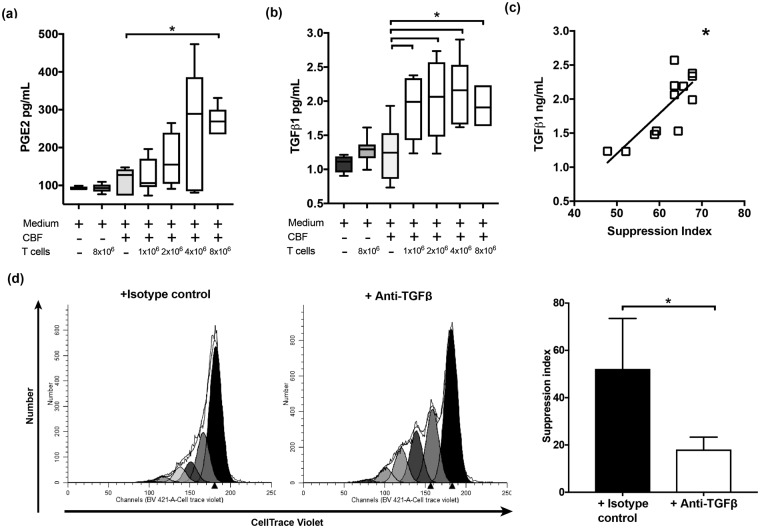
Figure 2.
PGE2 (a) and TGF-ß1 (b) levels in the supernatants of co-cultures of CBFs and T cells. A stepwise increase in TGF-ß1 concentrations with increased numbers of T cells compared to CBF only (Mann-Whitney *p = < 0.05) and other controls, in contrast to PGE2 where these trends were less obvious. (n ≥ 7) in all co-culture ratios and (n = 3) in 8 × 10⁶ T cells/gm of CBF. (c) Positive correlation between TGF-ß1 and T-cell SI in co-cultures of T cells and CBFs (spearman rho r = 0.673, p = <0.05). (d) CBF-driven immunomodulation in the presence of TGF-ß neutralising antibodies or isotype control antibody (co-culture ratio: 1 × 10⁶ T cell/gm CBF) fluorescence histograms for a representative sample (left) and combined data (n = 3, right, paired t test, *p = <0.05).

