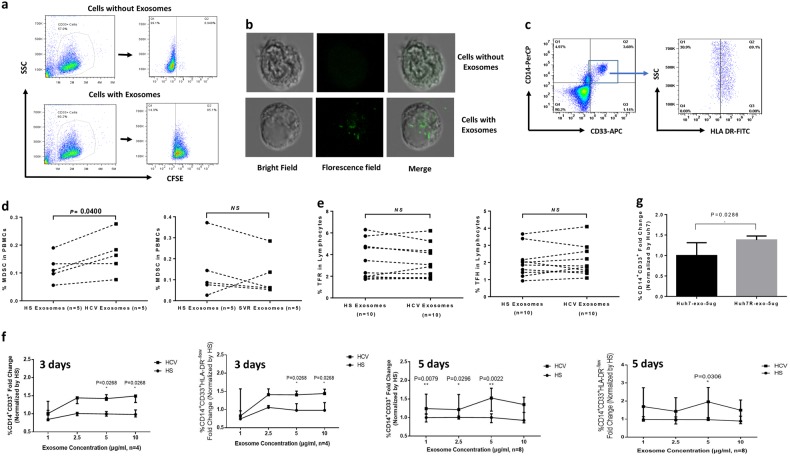
Fig. 3. Exosomes are taken up by myeloid cells and promote MDSC development.
a Representative dot plots of flow cytometric analysis of the uptake of CFSE-labeled exosomes by the purified myeloid cells. Isolated exosomes were labeled with CFSE, incubated with the purified CD33+ myeloid cells, followed by flow cytometric analysis for the uptake of CFSE-labeled exosomes. Cells incubated without exosomes served as control. b Confocal microscopic analysis of the uptake of CFSE-labeled exosomes by CD33+ myeloid cells. Cells incubated without exosomes served as negative control. A typical cell with bright light field, florescence field and merge is shown. c Representative dot plots showing the gating strategy for flow cytometric analysis of CD14+CD33+HLA-DR− MDSCs. d Summary data of flow cytometric analysis of the MDSC frequencies in PBMCs exposed to HS-Exo, HCV-Exo and SVR-Exo for 3 days. e Summary data of flow cytometric analysis of the TFR and TFH cell frequencies in PBMCs exposed to HS-Exo, HCV-Exo and SVR-Exo for 3 days. f Summary data of flow cytometric analysis of the kinetic changes in monocytic myeloid cells and MDSCs in PBMCs treated with HCV-Exo and HS-Exo in a time- and dose-dependent manner. Those with statistically significant fold changes of M-MCs and M-MDSCs induced by HCV-Exo (normalized by HS-Exo) are marked as *P < 0.05 or **P < 0.01. g Induction of monocytic myeloid cells by exosomes isolated from the supernatants of HCV-infected (Huh7R) and uninfected (Huh7) hepatocytes. The data were reproducible in three independent experiments. *P < 0.05, **P < 0.01

