Figure 5.
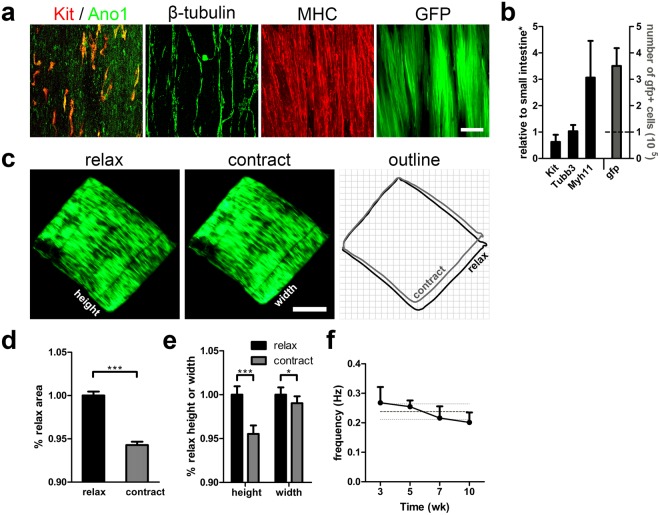
Engineering aligned intestinal smooth muscle with periodic contraction over 10 weeks in vitro. 100 k ISMC Mix were cultured on STO cells seeded ePCL scaffolds in FBS medium for the first 4 days before changing to F12 medium. (a) Confocal images of ISMC Mix with ICC markers showing co-localization (yellow) of Kit (red) and Ano1 (green), SMCs marker MHC (red), neuronal marker β-tubulin (green), and GFP (green) at 10 weeks. Scale bar, 100 µm. (b) GFP + ISMC Mix were analyzed for mRNA expression (Kit, Myh11, Tubb3, Kitl, and Acta2) (n = 5) and gfp DNA (n = 4). The dashed line indicates the seeding density. (c–e) Relaxed and contracted state comparison of engineered intestinal smooth muscle. (c) Images of GFP expression from ISMC Mix seeded ePCL scaffold were extracted from a video recording and outlined (relax, black; contract, gray) for comparison. Scale bar, 2 mm (Supplementary Video 4). (d) To show the degree of the periodic contraction, area of contracted ePCL scaffolds were normalized to that of relaxed ePCL scaffolds (n = 10). (e) To show the directionality of the periodic constriction, height and width of contracted ePCL scaffolds were normalized to those of relaxed ePCL scaffolds (n = 10). (f) Frequency of ePCL rhythmic contractions (n = 4). The dark gray dashed line indicates the mean frequency over time and light gray dashed lines indicate its s.d. *Samples were normalized to de-epithelialized intestine. Error bars, s.d. ***P < 0.0001, *P < 0.05.

