
Figure 3.
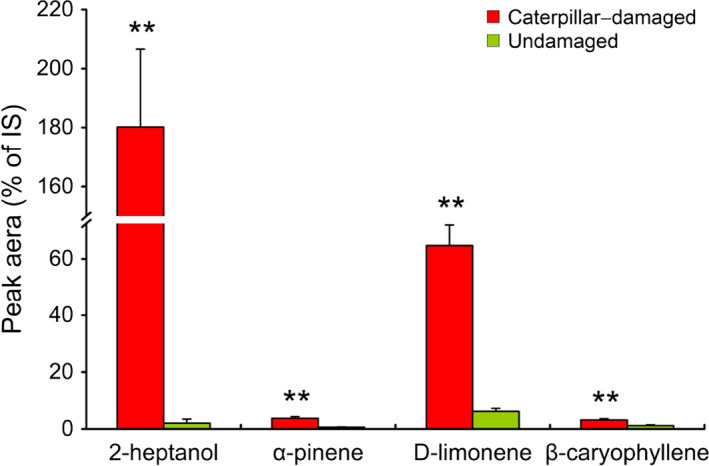
Relative amounts of volatile compounds emitted from caterpillar‐damaged and undamaged non‐Bt rice plants. Values are mean percentages ± SE of the peak area of the internal standard (nonyl acetate). Asterisks indicate significant differences between undamaged and caterpillar‐damaged rice plants (Student's t‐test, **P < 0.01). Data were log10(x + 1) transformed before analyses.