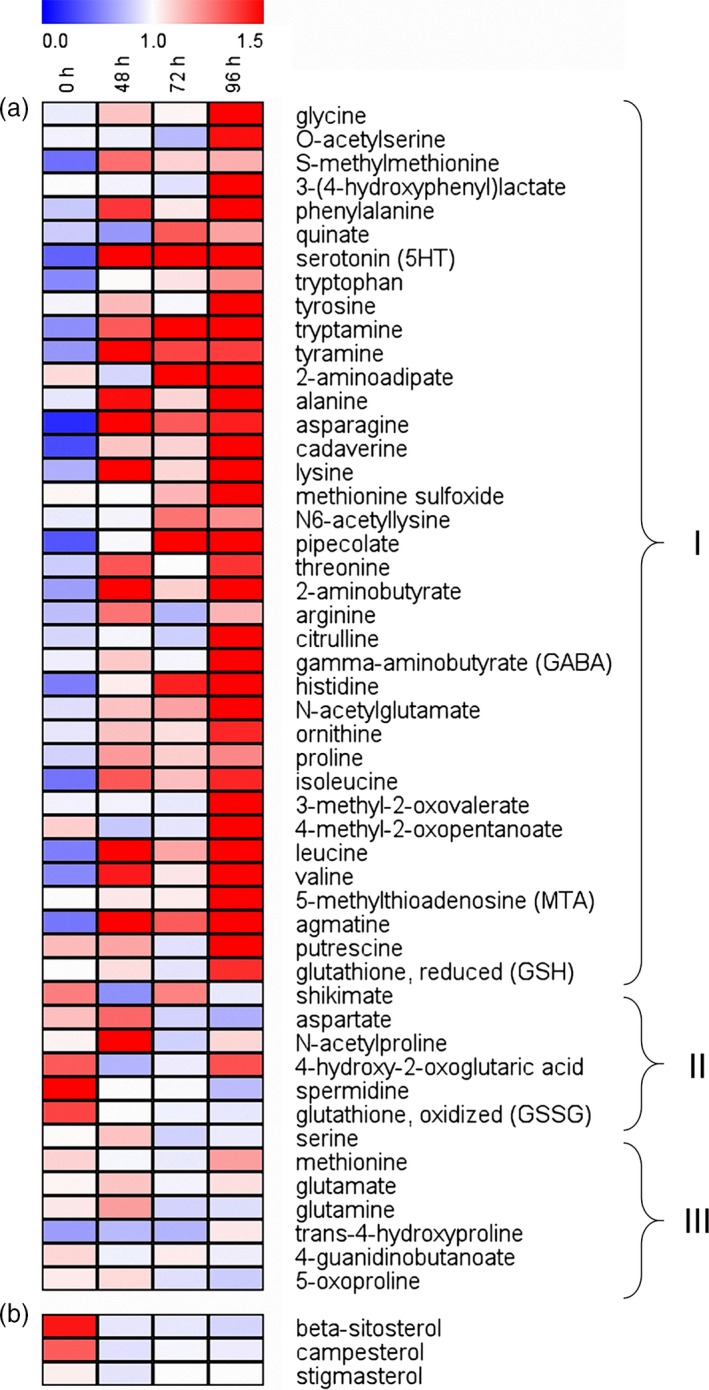
Figure 4.

Heatmap presentation of the metabolites in non‐Bt rice stems after infestation by one 3rd instar of Chilo suppressalis for 0, 48, 72 and 96 h. (a) Amino acids whose contents increased (I), decreased (II) or did not apparently change (III) in rice stems with increasing caterpillar damage. (b) Sterols. Each line in the heatmap represents one metabolite. The colour code indicates the content of each metabolite relative to the median metabolite concentration. Values were generated by normalizing directly on a similar graphic scale by their median values. Red indicates a higher content, and blue indicates a lower content of the metabolite in the sample.
