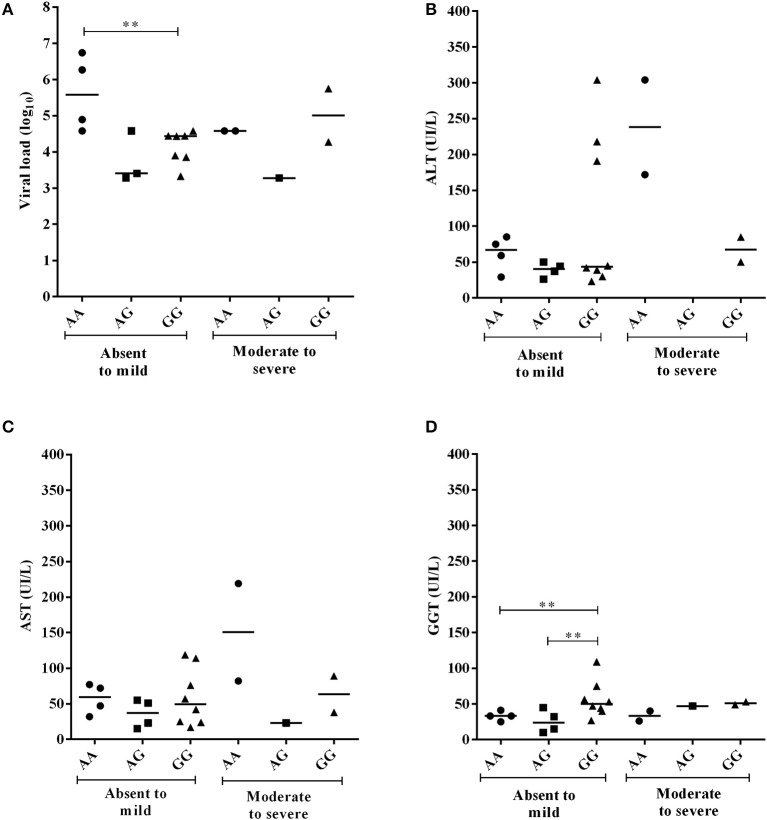
Figure 5.
Comparison of plasma viral loads (log10) and liver enzyme levels in individuals with −924A>G polymorphism genotypes in CHB-A patients according to the degree of inflammatory activity. Statistical significance was observed for the plasma viral loads (log10) (A) and GGT levels (B) at the milder stages of tissue inflammation (**), but not to AST and ALT enzymes (C,D).

