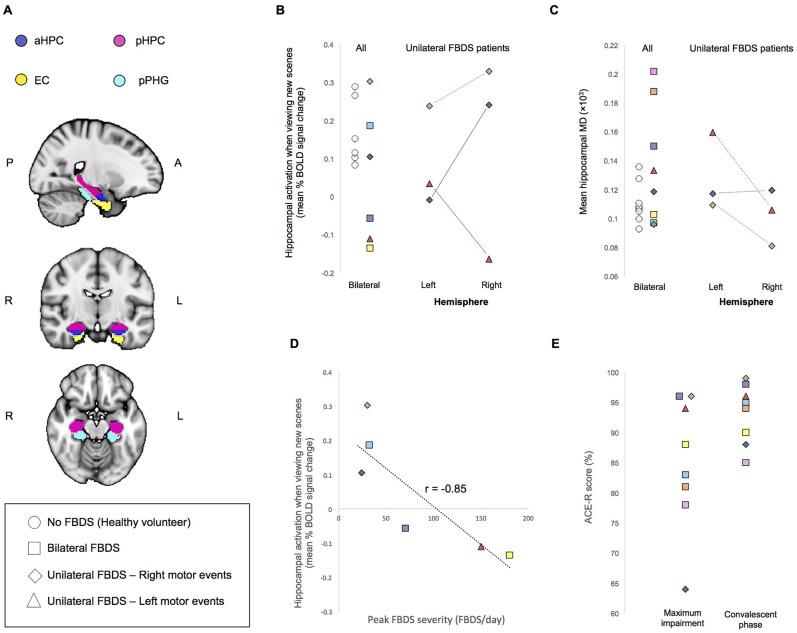
Figure 1.
(A) Regions of Interest (ROIs) used for analysis. aHPC, anterior hippocampus; pHPC, posterior hippocampus; EC, entorhinal cortex; pPHG, posterior parahippocampal gyrus. (B) Mean percent BOLD signal difference during the encoding of new scenes verses viewing familiar scenes and (C) Mean hippocampal MD. For individuals who had unilateral FBDS, hemisphere specific measures are additionally plotted. Solid lines indicate between hemisphere differences in the predicted direction (based on clinically observed laterality of FBDS motor events), whereas dashed lines indicate between hemisphere differences were not in the predicted direction. (D) Correlation between peak FBDS severity and mean bilateral percent BOLD signal change in hippocampus during the encoding of new scenes compared to when viewing familiar scenes is plotted. Refer to Table 1 to match symbols of participating FBDS patients with individual demographic and clinical characteristics. (E) Peak ACE-R score at the time of peak impairment during the convalescent phase (day of neuroimaging assessment).

