Figure 1.
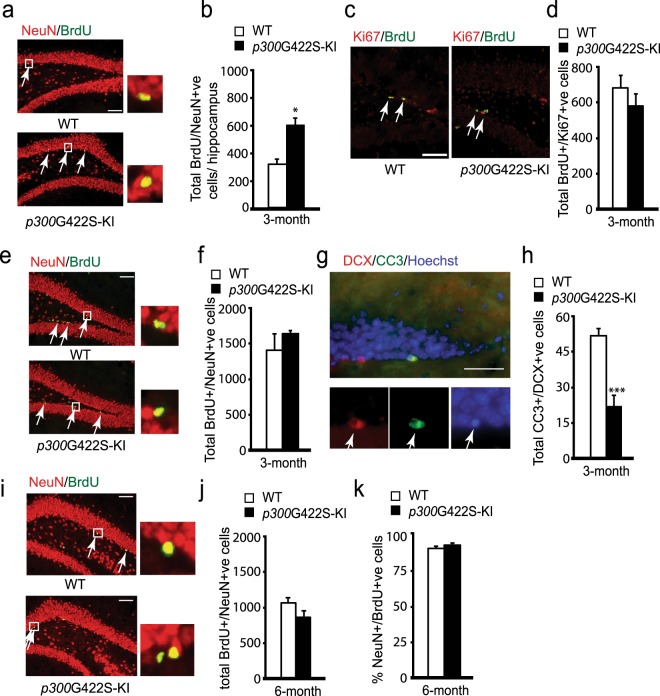
p300G422S-KI increases adult neurogenesis at the age of 3 months by reducing cell death of newborn neurons. (a) Representative images of hippocampal sections from 3-month p300G422S-KI (homologous p300G422S-KI) and their WT, sacrificed 30 days after BrdU injections, and stained for BrdU (green) and NeuN (red). Arrows represent BrdU+/NeuN+ neurons. Scale bar = 20 µm. (b) Quantitative analysis of the total number of BrdU+/NeuN+ newborn neurons in the hippocampi from 3 months WT and p300G422S-KI, as shown in (a). (c) Representative fluorescence images of hippocampal sections from 3 months WT and p300G422S-KI mice, sacrificed one day after BrdU injections, stained for BrdU (green) and Ki67 (red). Arrows denote BrdU+/Ki67+ proliferating cells. Scale bar = 20 μm. (d) Quantitative analysis of the total number of BrdU+/Ki67+ proliferating cells in the hippocampi from 3 months p300G422S-KI and their WT littermates. (e) Representative images of hippocampal sections from 3 months WT and p300G422S-KI mice, sacrificed 12 days after BrdU injections, stained for BrdU (green) and NeuN (red). Arrows represent BrdU+/NeuN+ neurons. Scale bar = 20 µm. (f) Quantitative analysis of the total number of BrdU+/NeuN+ neurons in the hippocampi from WT and p300G422S-KI mice (3-month) as shown in (e). (g) Representative images of hippocampal sections from 3-month WT mice, stained for cleaved caspase 3 (CC3) (green) and DCX (red). Arrows denote CC3+/DCX+ cells. Scale bar = 10 μm. (h) Quantitative analysis of the total number of CC3+/DCX+ cells in the hippocampi from 3 months p300G422S-KI and their WT littermates. (i) Representative images of hippocampal sections from 6 months WT and p300G422S-KI mice, sacrificed 12 days after BrdU injections, stained for BrdU (green) and NeuN (red). Arrows represent BrdU+/NeuN+ neurons. Scale bar = 20 µm. (j,k) Quantitative analysis of total number (j) and the proportion (k) of BrdU+/NeuN+ cells in the hippocampi from WT and p300G422S-KI mice (6 months) as shown in (i). The boxed areas were shown at higher magnification on the right panels in (a,e,i). *p < 0.05; ***p < 0.001, n = 4 animals for each group.

