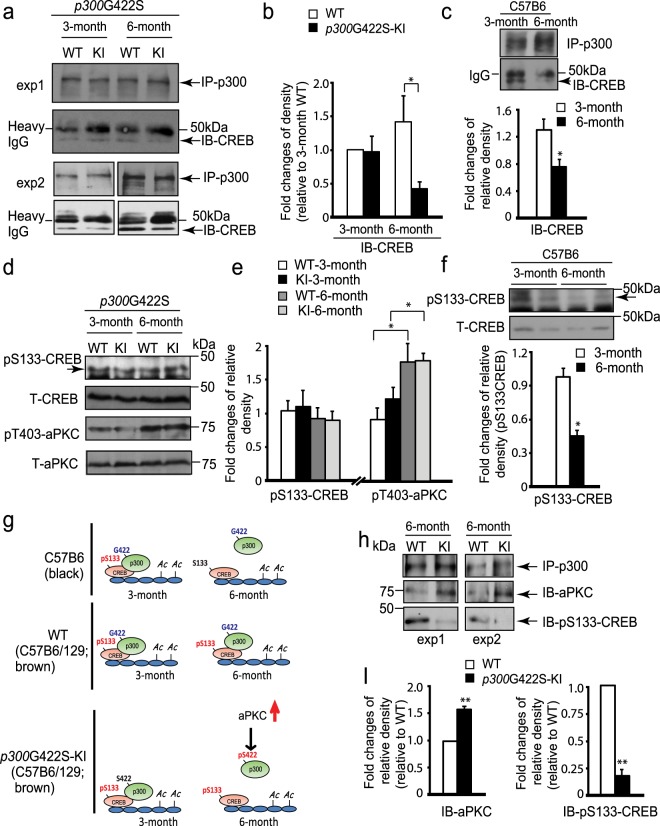
Figure 2.
p300G422S-KI shows the impaired CREB binding to p300 at the age of 6 but not 3 months. (a) Co-immunoprecipitation analysis of the interaction between p300 and CREB in the hippocampi of WT and p300G422S-KI mice at 3 and 6 months. Hippocampal lysates were immunoprecipitated with a p300 antibody, washed and blotted with the indicated antibody. Arrow indicates CREB expression band. (b) The graph indicates the fold changes of the relative pulled-down CREB protein over the total p300 amounts, as determined by densitometry and normalized to samples from 3 months WT, (two-way ANOVA: F (1,16) = 4.86, p = 0.04; Tukey’s multiple comparisons, *p < 0.05, n = 5). (c) Co-immunoprecipitation analysis of the interaction between p300 and CREB in C57B6 strain hippocampi at the age of 3 and 6 months as described in (a). The graph data was normalized to one of 3 months old C57B6 samples. (d) Western blot analysis for pS133-CREB and pT410/403-aPKC zeta/iota in hippocampal extracts from 3 and 6 months WT and p300G422S-KI mice. Blots were reprobed for total CREB or aPKC as loading controls. (e) Graphs show relative levels of pS133-CREB and pT410/403-aPKC over total CREB and aPKC, respectively, normalized to one of 3 months WT samples. (f) Western blot analysis for pS133-CREB in hippocampal extracts from 3 and 6 months C57B6 mouse strain. Blots were reprobed for total CREB as a loading control. Graphs show relative levels of pS133-CREB over total CREB, normalized to one of 3 months C57B6 samples. (g) Schematic model showing that both pS133-CREB and pS422-p300 determine the interaction between p300 and CREB. (h) Co-immunoprecipitation analysis of the association of p300 with pS133-CREB and total aPKC in the hippocampi of 6 months WT and p300G422S-KI mice. (i) The graph indicates the fold changes of the relative pulled-down pS133CREB protein and total aPKC over the total p300 amounts, as determined by densitometry and normalized to 6 months WT samples. exp1: individual experiment 1; exp2: individual experiment 2. *p < 0.05; **p < 0.01, n = 3–5 animals for each group. Images derived from different part of the same gel were cropped for layout reasons. Full-length blots/gels are presented in Supplementary Fig. 2.

