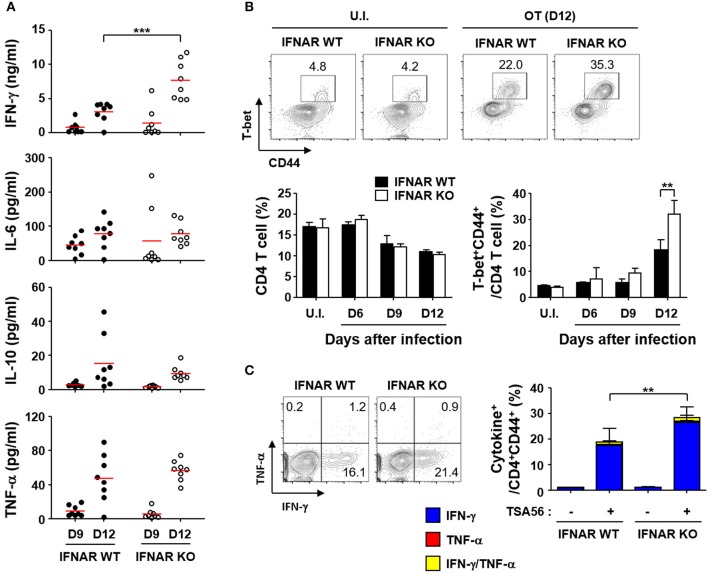
Figure 4.
Enhanced IFN-γ, Th1, and CD8 T cell responses by O. tsutsugamushi infection in the absence of type I IFN signaling. (A) Levels of cytokines in plasma collected at the indicated days after infection in wild type or IFNAR KO mice (n = 8/group) were determined. IL-2, IL-4, and IL-12p70 were barely detectable throughout the infection period (data not shown). Red line, mean; ***p < 0.001. (B) Proportion of T-bet+CD44+ activated Th1 cells among CD4 T cells were analyzed in spleens of wild type and IFNAR KO mice infected by O. tsutsugamushi. Representative images of flow cytometric results are presented (upper) and proportion of CD4 T cells (lower left) and activated Th1 cells (lower right) are summarized (n = 3/group). Data represent mean + SD of three independent experiments. **p < 0.01. U.I., uninfected; OT (D12), infected with O. tsutsugamushi for 12 days. (C) Splenocytes were collected from wild type and IFNAR KO mice at 12 days after infection with O. tsutsugamushi and production of IFN-γ and/or TNF-α in activated (CD44+) CD4 T cells were analyzed by flow cytometry. Representative flow cytometric results are presented (left) and the percentile of cytokine positive cells among the activated T cell subsets are summarized (right graph) in the absence and presence of TSA56 antigen. Data represent mean + SD from wild type (n = 5) or IFNAR KO (n = 8) mice. **p < 0.01. Blue box, IFN-γ-positive; red box, TNF-α-positve; yellow box, IFN-γ and TNF-α-positive.

