Figure 3.

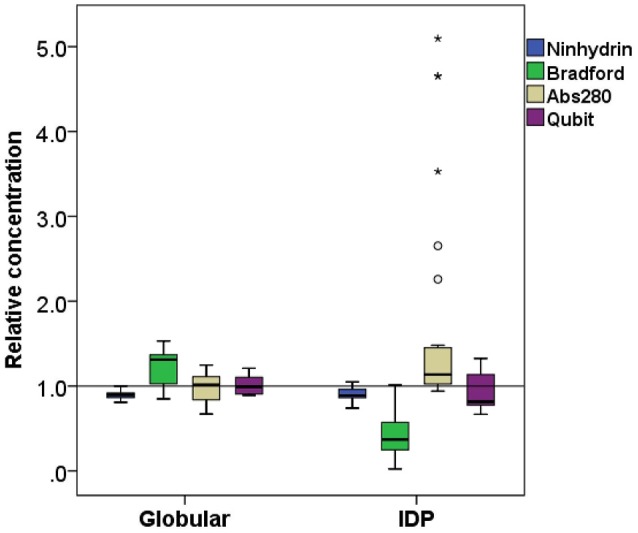
Comparison of relative concentration measurements of folded and disordered proteins. Box plots of the relative concentration of globular and disordered proteins measured by the four methods ninhydrin, Bradford, Abs280, and Qubit.

Comparison of relative concentration measurements of folded and disordered proteins. Box plots of the relative concentration of globular and disordered proteins measured by the four methods ninhydrin, Bradford, Abs280, and Qubit.