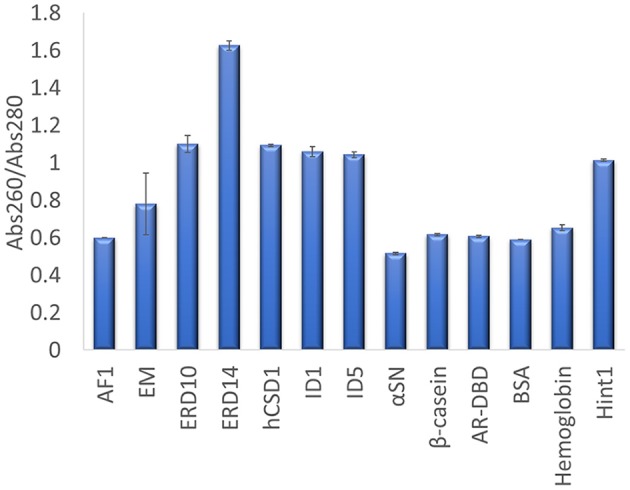
Figure 4.

Abs260/Abs280 ratio for each protein determined on a Nanodrop. UV absorbance of each protein was measured in triplicate at 260 and 280 nm, to derive their Abs260/Abs280 ratio. The average value is shown and the error bars represent the standard deviation for each protein sample. A high ratio of ERD14 suggests an inherent nucleic acid contamination.
