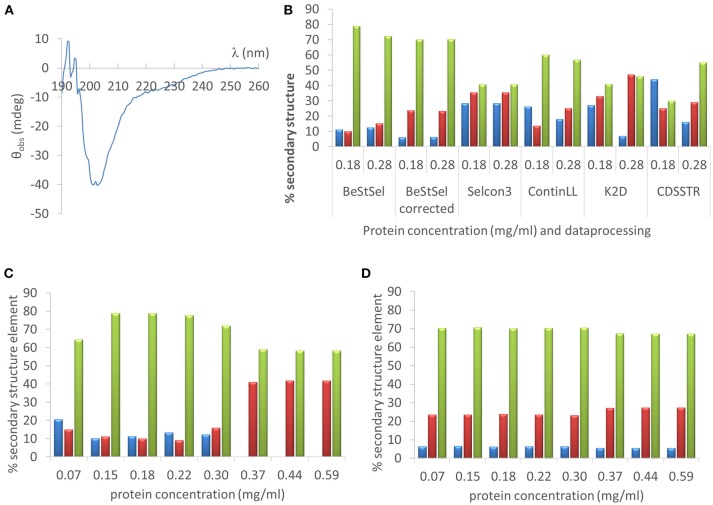
Figure 5.
Far UV CD analysis of hCSD1 (A) The far UV CD spectrum of hCSD1 corresponds to a prototypical spectrum of a random coil. (B) Deconvolution of the CD spectrum of hCSD1 by DichroWeb and BeStSel. The CD spectrum was deconvoluted by assuming two different hCSD1 concentrations (0.18 and 0.28 mg/ml) by either BestSel or through the DichroWeb server. BeStSel was run by two different options (without and with concentration correction), whereas on DichroWeb four different algorithms were used (Selcon3, ContinLL, K2D and CDSSTR). (C,D) Deconvolution of the CD spectrum of hCSD1 with BeStSel. The CD spectrum was deconvoluted to yield the % secondary structure composition (α-helix, β-strand and coil) of hCSD1 by BeStSel. The program was run both without (C) and with (D) the application of “Best” factor correction at a broad, but not unrealistic, range of measured concentrations.

