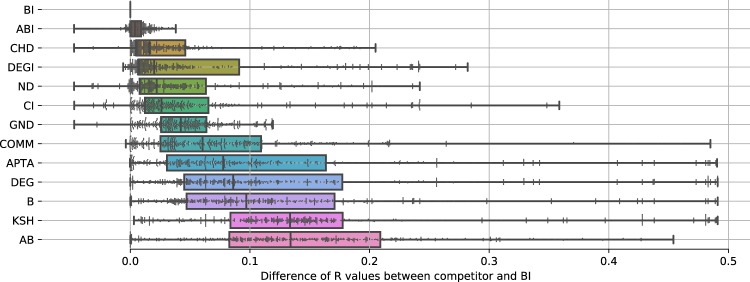
Figure 7.
Comparison of R values for different competitors against BI, the most accurate method in our study. For each competitor, we plot the distribution of all R values as a box plot. Each box covers the values within boundaries X,Y. Competitors are sorted according to their median deviations to BI values. The best competitors are ABI and CHD, which have an absolute difference in R values of 0.01–0.02 for the majority of network instances. Moreover, their maximum deviation is between 0.05–0.08. Other competitors, including AB and DEG, have much higher deviations, with a difference of 0.5 as the maximum case, which essentially renders them useless for accurate estimations of network robustness.

