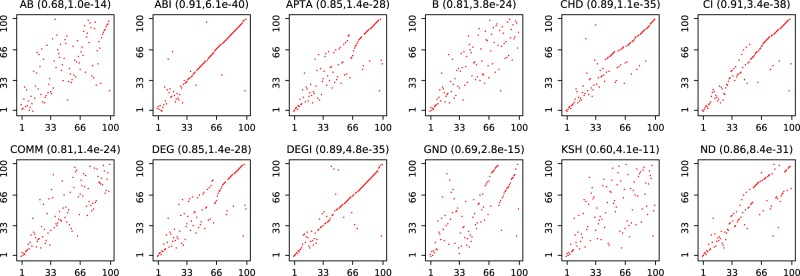
Figure 8.
Correlation of node removal strategies for each competitor against BI, for a BA network with n = 100 and m = 3. For each pair of competitors, a dot represents a node in the network, while the x-coordinate is the rank in the first competitors and the y-coordinate is the rank in BI. A straight line indicates a perfect correlation between rank orders, while a scattered collection of points indicates rather uncorrelated ranks. For each pair of competitors, we show the correlation coefficient and p-value in parenthesis. For instance, ABI and BI are highly correlated, with a correlation coefficient of 0.91 and p-value of 6.1e−40 for this specific network.

