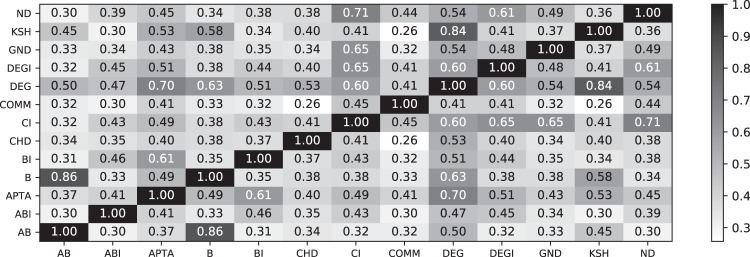
Figure 9.
Order comparison of all against all for small values of R (smaller than 0.05). For each network realization, we have computed the pairwise correlation coefficient for all competitors. The number reports the median correlation coefficient over all network realizations. Cells filled in darker color have a larger median correlation coefficient. The diagonal represents pairs of identical competitors. B and AB are correlated most. Other interesting high correlations include CI/ND, DEG/KSH, and B/DEG.

