Fig. 2.
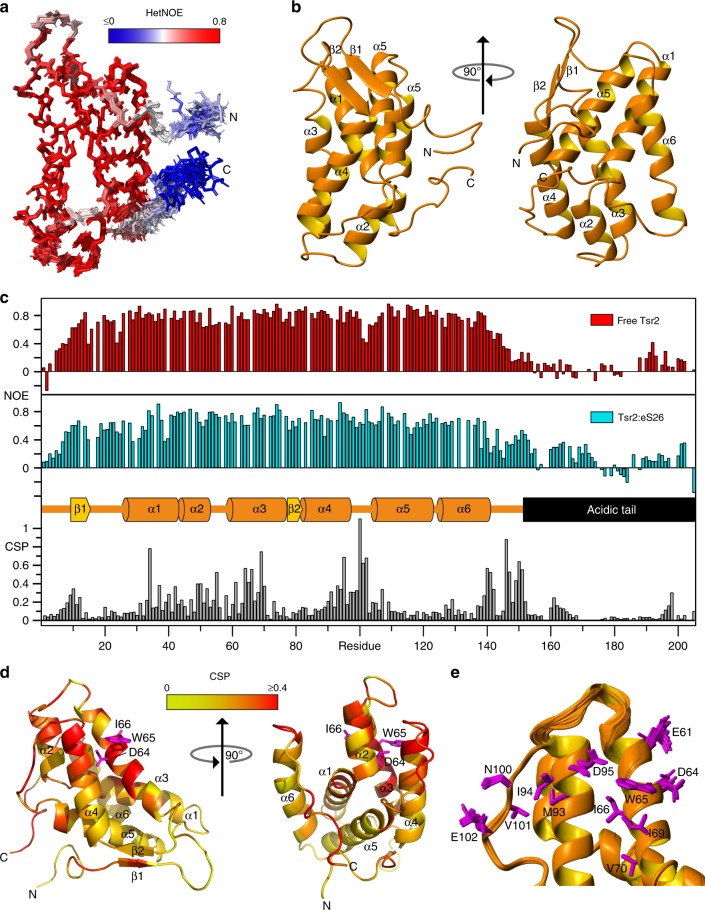
Structure of Tsr2-N and in complex with eS26 revealed by NMR. a Superposition of the 20 lowest-energy conformers representing the NMR solution structure of Tsr2-N after energy-minimization with AMBER. The N- and C-termini are indicated with N and C, respectively. The color coding reflects the conformational mobility of individual backbone amides derived from the {1H}15N NOE experiment and ranges from blue to red for flexible and rigid moieties, respectively. b Cartoon representation of Tsr2-N with labels indicating α-helices and β-strands. c Upper panel: {1H}15N NOE data of full-length Tsr2 in the absence and presence eS26. Lower panel: The combined 1H and 15N chemical shift perturbation (CSP) of full-length Tsr2 upon binding to eS26. Secondary structure boundaries of Tsr2-N as well as the acidic tail region are indicated in the center. d CSP data from c visualized on a cartoon representation of the lowest-energy conformer of Tsr2-N. The color coding reflects the perturbation of individual amide resonances and ranges from yellow (CSP = 0 ppm) to red (CSP ≥ 0.4 ppm). Sidechains of residues D64, W65, and I66 are shown. e Sidechains of residues with a particularly large CSP are indicated in magenta on a cartoon representation of the ensemble of 20 Tsr2-N conformers

