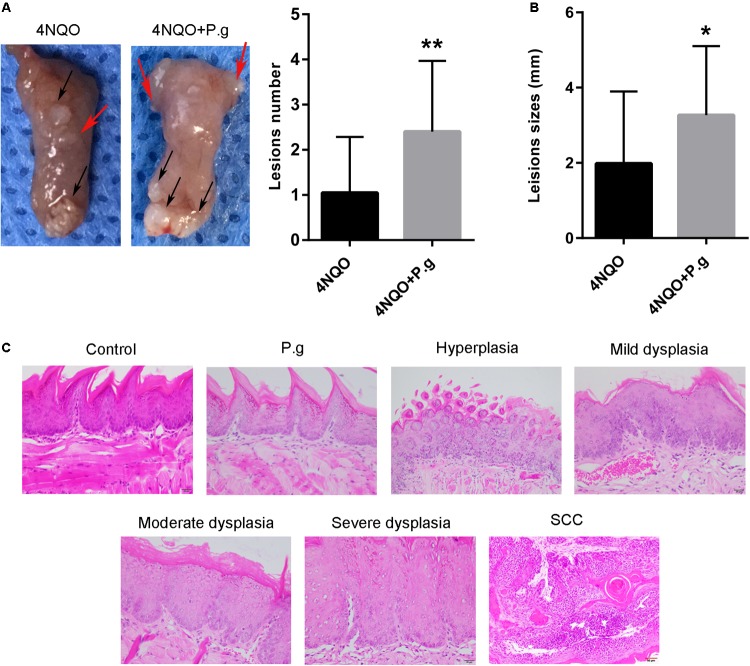
FIGURE 3.
Effect of P. gingivalis infection on tongue carcinogenesis in 4NQO-treated mice. (A) Representative imagines tongue tissues and the quantitative data of lesion number per mice in 4NQO and 4NQO + P.g group were shown. Black arrows indicate tumors; red arrows indicate dysplasia. The columns represent the mean ± SEM of 10 animals per group; ∗∗P < 0.01. (B) The average of lesion sizes in mice of 4NQO and 4NQO + P.g group. The columns represent the mean ± SEM of 10 animals per group; ∗P < 0.05. (C) Representative HE sections of pathology, including hyperplasia, mild dysplasia, moderate dysplasia, severe dysplasia, and carcinoma. All images were taken at 400× magnification.

