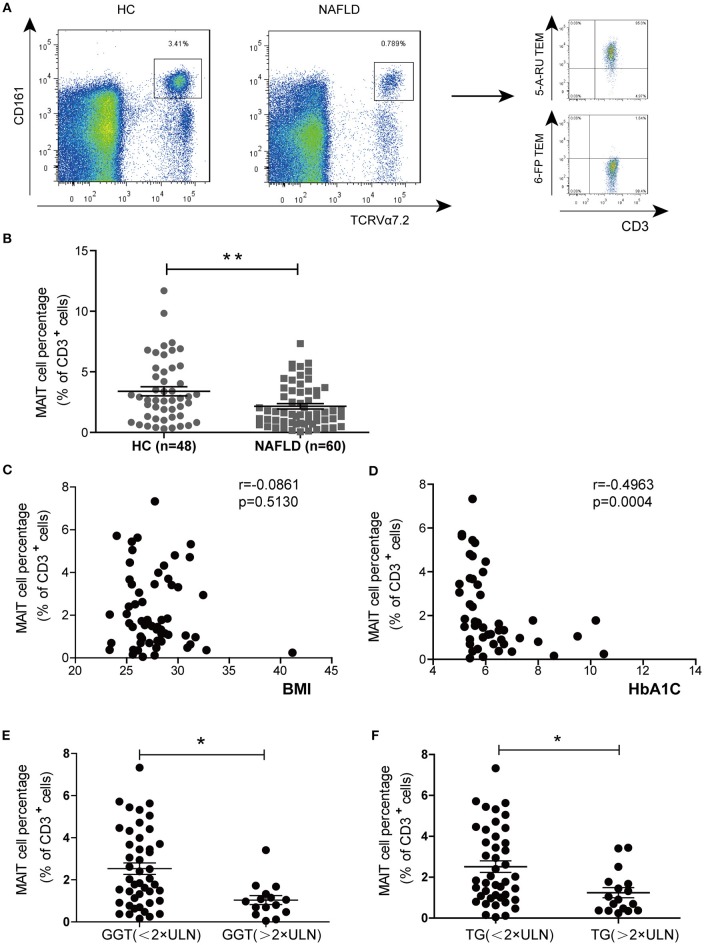
Figure 1.
MAIT cell percentages among circulating CD3+ T cells in HC and NAFLD patients, as well as correlations between circulating MAIT cell percentage and clinical parameters in NAFLD patients. (A) Representative flow cytometry scatter plots from HC and NAFLD patient (Left panel). CD3+CD161highVα7.2+ cells were confirmed by MR1-5-OP-RU TEM and MR1-6-FP TEM (negative control) (Right panel). (B) Statistical analysis of circulating MAIT cell frequency in HC (n = 48) and patients with NAFLD (n = 60). Spearman correlation between MAIT frequency with (C) HbA1c (n = 47) and (D) BMI (n = 60) in NAFLD patients. (E,F) NAFLD patients with higher serum GGT or TG (> 2 × ULN) had lower peripheral MAIT cell percentage than those patients with lower (< 2 × ULN) GGT or TG. Data were analyzed with Mann–Whitney U-tests. *P < 0.05, **P < 0.01. TEM, tetramer; BMI, body mass index; GGT, γ-glutamyl transferase; TG, triglyceride; ULN, upper limit of normal.

