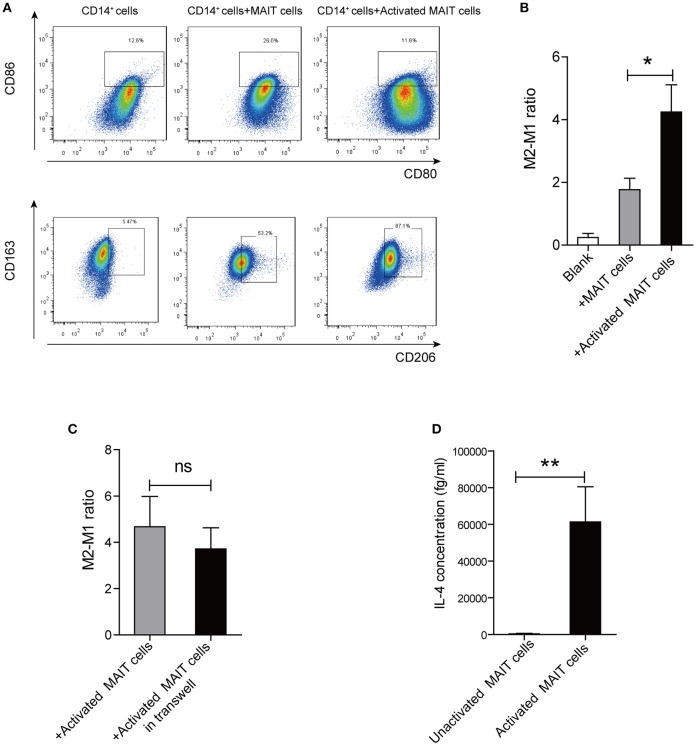
Figure 4.
Macrophage polarization induced by activated MAIT cells in vitro. (A) Representative flow cytometry scatter plots of M1 (HLADR+CD80+CD86+) and M2 (CD163+CD206+) phenotype in CD14+ monocytes treated with unactivated MAIT cells or activated MAIT cells. (B) A higher M2/M1 ratio in macrophages co-cultured with activated MAIT cells (n = 5). (C) No significant difference in M2/M1 cells ratio among macrophages treated with activated MAIT cells between co-culture system and transwell experiments (n = 4). (D) Comparison of IL-4 production in unactivated and activated MAIT cells (n = 4). Data were analyzed with paired t-test and Mann–Whitney U-test. *P < 0.05, **P < 0.01, ns: no statistical significance.

