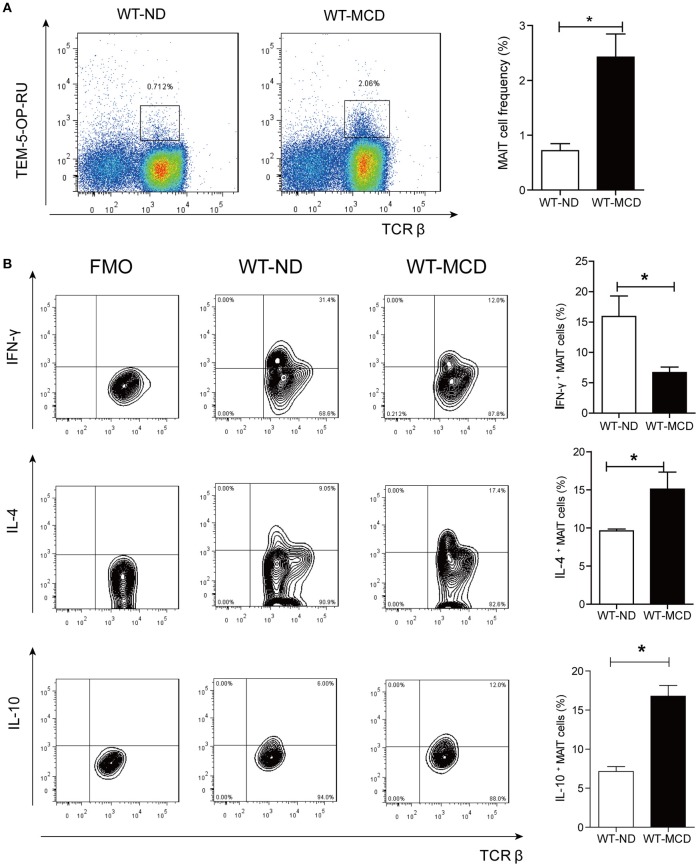
Figure 5.
Frequency and cytokines profile of MAIT cell in livers of WT-ND mice and WT-MCD mice. (A) The frequency of MAIT cells in liver from WT mice on ND and MCD. (B) The percentage of PMA-ionomycin-stimulated intra-hepatic MAIT cells that produce IFN-γ, IL-4, or IL-10 in WT mice upon ND and MCD (n = 6). Data were analyzed with Mann–Whitney U-test. *P < 0.05. WT, wild type; ND, normal diet; MCD, methionine and choline deficient diet; TEM, tetramer.

