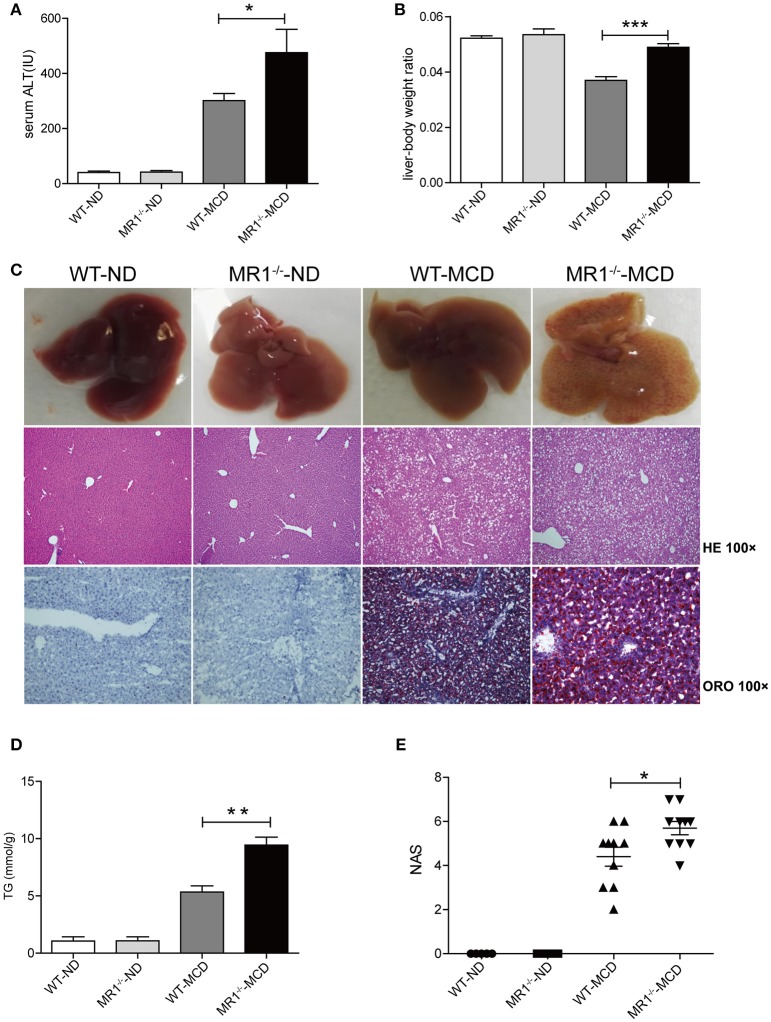
Figure 6.
More severe hepatic steatosis and inflammation in MR1−/− -MCD mice compared with WT-MCD mice. WT serum ALT levels (A) and liver-to-body weight ratio (B) in WT and MR1−/− mice on ND and MCD. (C) The gross picture, HE and ORO staining of livers from WT and MR1−/− mice on ND and MCD (original magnification, × 100) (n = 10). TG level (D) and NAS (E) of livers in mice in WT and MR1−/− mice upon ND and MCD (n = 10). Data were analyzed using ANOVA with Bonferroni test comparison. *P < 0.05, **P < 0.01, ***P < 0.001. ALT, alanine aminotransferase; HE, hematoxylin and eosin; ORO, oil red O; TG, triglyceride; NAS, NAFLD activity score.

