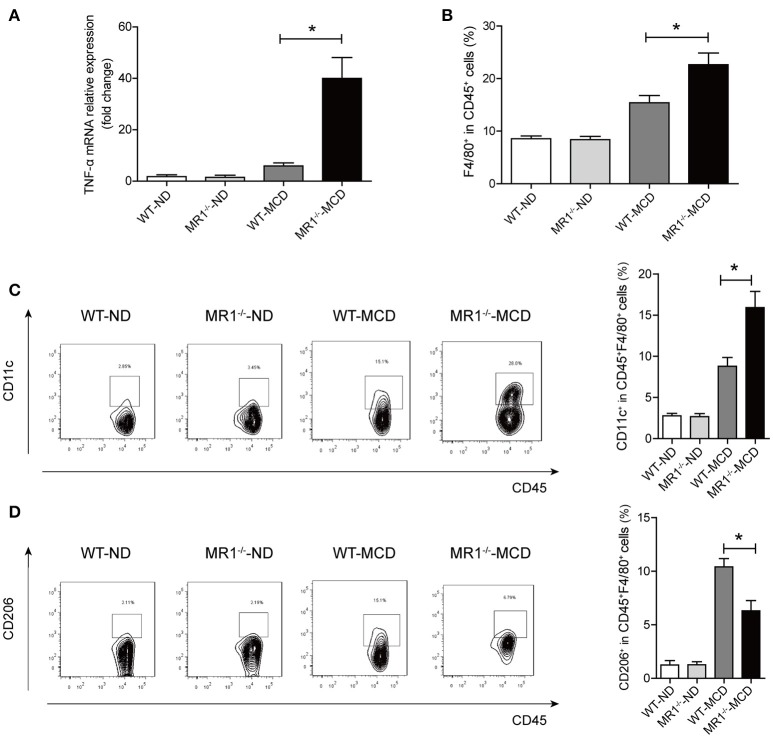
Figure 7.
Comparisons of pro-inflammatory cytokine expression and macrophages in livers between MR1−/−-MCD mice and WT-MCD mice. (A) Hepatic expression of the TNF-α mRNA in WT and MR1−/− mice on ND and MCD. (B) Higher total macrophage (F4/80+) number in liver of MR1−/− mice on MCD compared to WT-MCD mice. Representative dot plots and the percentage of CD11c+ macrophages (C) and CD206+ macrophages (D) from individual mice in WT and MR1−/− group on ND or MCD (n = 10). Data were analyzed using ANOVA with Bonferroni test comparison. *P < 0.05.

