
Figure 6.
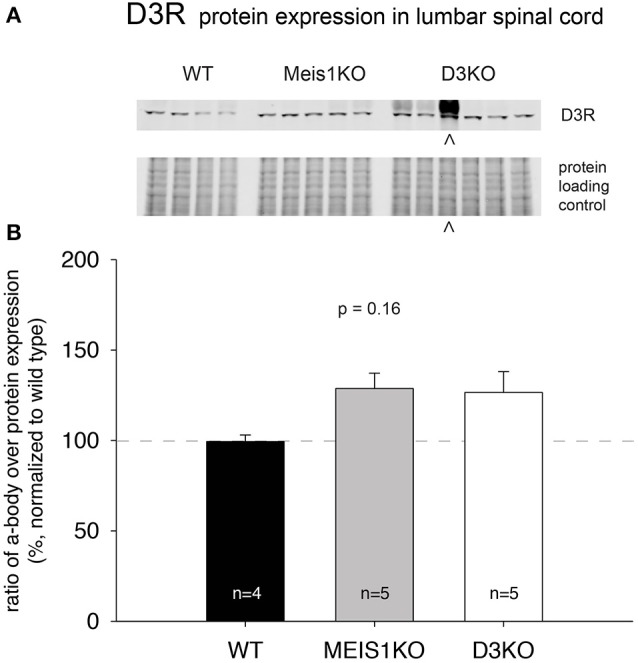
D3R expression in the lumbar spinal cord. (A). Western blot of D3R protein expression in the spinal cord. Top: D3R protein band; bottom: protein loading control. (B). Quantification of D3R protein expression in the spinal cord, normalized to protein loading control / lane. D3R expression was not significantly altered in Meis1KO and D3KO animals. ∧: D3KO lanes that were excluded from the subsequent analysis.