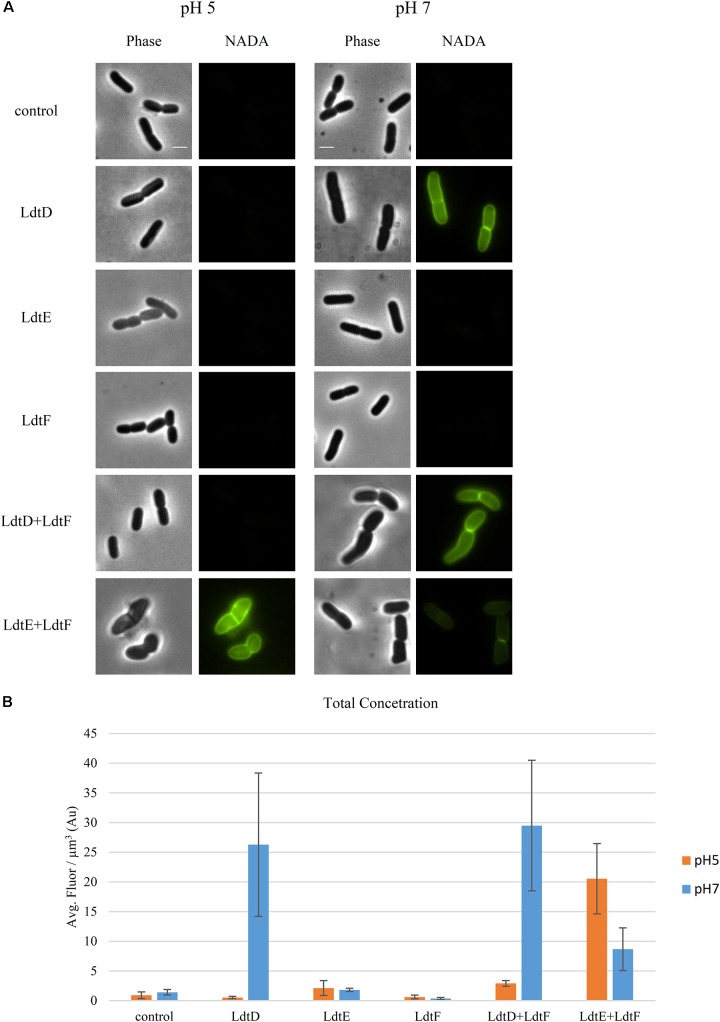
FIGURE 2.
Incorporation of NADA is pH dependent. (A) Phase contrast and corresponding fluorescence images of BW25113Δ6LDT cells not expressing (control) or expressing ldtD, ldtE, ldtF, ldtD and ldtF, or ldtE and ldtF at pH 5.0 or 7.0, and labeled with NADA. Cells were grown to exponential phase in LB at 37°C. LD-TPase genes expression was induced for two mass doubling with 50 μM IPTG, and the NADA pulse was for 2 min. Scale bar, 2 μm. (B) Concentration of NADA in cells of BW25113Δ6LDT strain not expressing (control) (n = 1000 at pH 5; n = 1216 at pH 7) or expressing ldtD (n = 903 at pH 5.0; n = 1329 at pH 7.0), ldtE (n = 768 at pH 5.0; n = 2116 at pH 7.0), ldtF (n = 331 at pH 5.0; n = 1335 at pH 7.0), ldtD and ldtF (n = 294 at pH 5; n = 518 at pH 7), or ldtE and ldtF (n = 444 at pH 5.0; n = 530 at pH 7.0). The values are mean ± SD of n number of cells.

