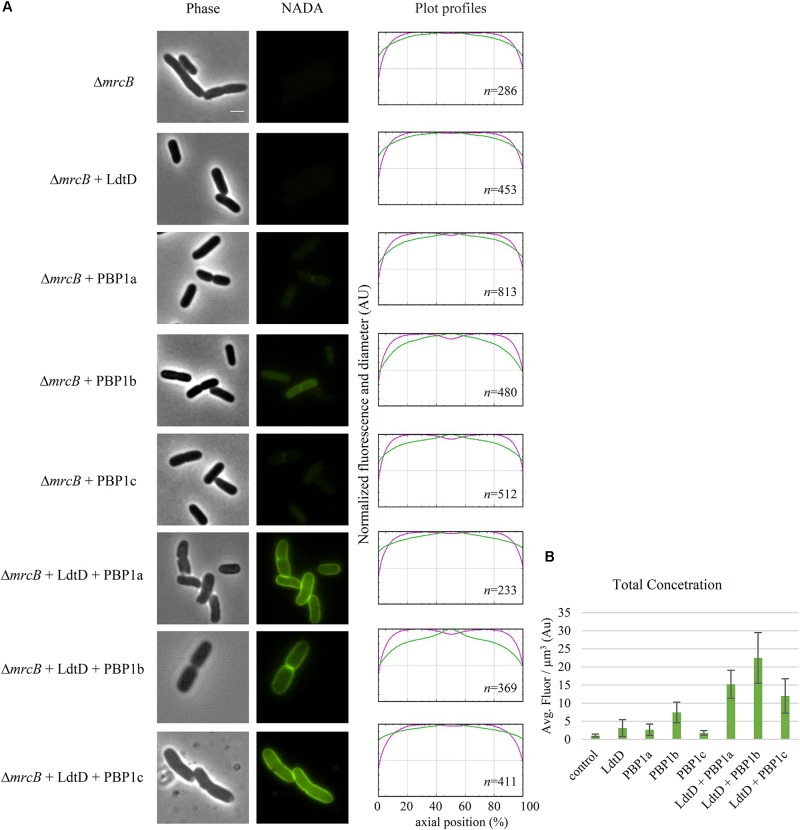
FIGURE 5.
Effect of plasmid-expressed genes encoding class A PBPs on NADA incorporation by LdtD. (A) Phase contrast and corresponding fluorescence images of BW25113ΔmrcB (without PBP1b) (control) expressing or not ldtD, mrcA, mrcB, pbpC, ldtD and mrcA, ldtD and mrcB, or ldtD and pbpC, labeled with a 0.5 mM NADA pulse of 2 min. Scale bar, 2 μm. The right panel shows the average normalized fluorescence profiles (green) and diameter (purple) per cell (from 0.0 to 1.0) plotted against normalized cell length (from 0 to 100%). n represents the number of cells analyzed. (B) Concentration is the NADA fluorescence (signal per μm3 average cell volume). Quantification of the incorporated NADA in cells of BW25113ΔmrcB (control) or expressing ldtD, mrcA, mrcB, pbpC, ldtD and mrcA, ldtD and mrcB, and ldtD and pbpC. The values are mean ± SD of n number of cells. n is indicated on the fluorescence profiles.

