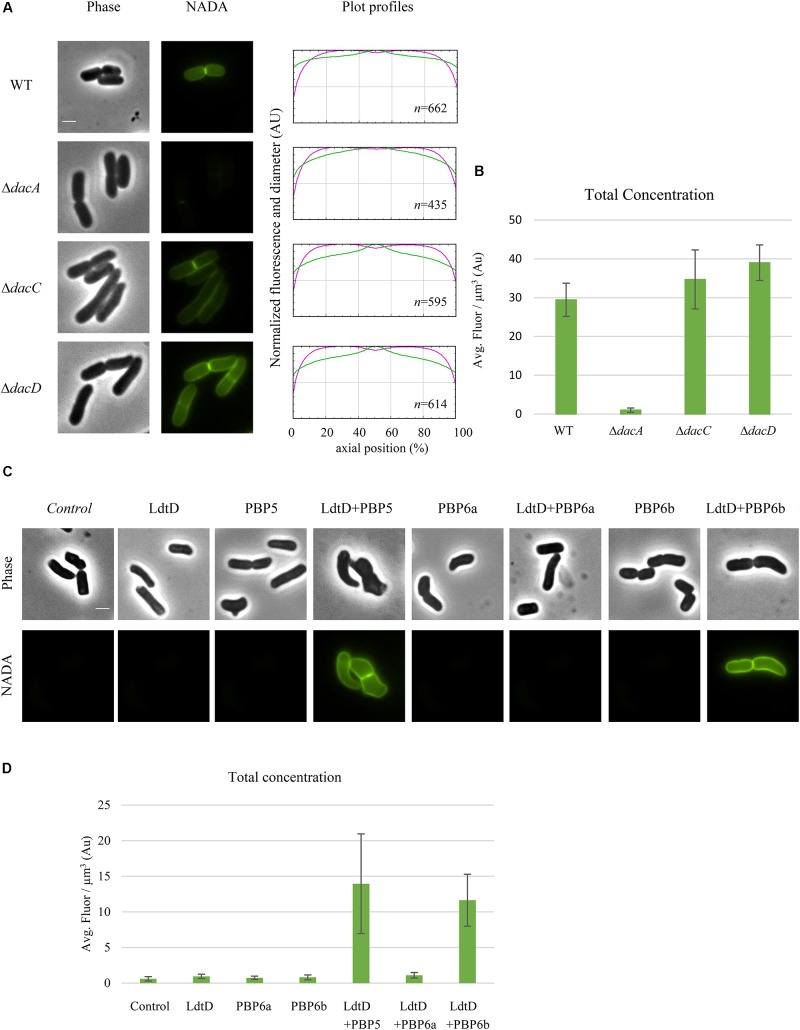
FIGURE 6.
Class C PBP activity is required for NADA incorporation by LdtD. (A) Phase contrast and fluorescence images of CS109, CS109ΔdacA (PBP5) expressing ldtD, CS109ΔdacC (PBP6a) expressing ldtD, and CS109ΔdacD (PBP6b) expressing ldtD labeled with a 0.5 mM NADA pulse of 2 min. Scale bar, 2 μm. The right panel shows the average fluorescence profiles (green) and diameter (purple) per cell (from 0.0 to 1.0) plotted against normalized cell length (from 0 to 100%). n represents the number of cells analyzed. (B) Total concentration is the NADA fluorescence (signal per μm3 average cell volume). Quantification of the incorporated NADA in the CS109 strain, CS109ΔdacA expressing ldtD, CS109ΔdacC expressing ldtD, and CS109ΔdacD expressing ldtD. The values are mean ± SD of n number of cells. (C) Phase contrast and fluorescence images of BW5113D6LDTDdacA cells not expressing (control) or expressing ldtD, dacA, ldtD and dacA, dacC, ldtD, and dacC, dacD, or ldtD and dacD, labeled with 0.5 mM NADA. Scale bar, 2 μm. The right panel shows the average fluorescence profiles (green) and diameter (purple) per cell (from 0.0 to 1.0) plotted against normalized cell length (from 0 to 100%). (D) Quantification of the total concentration of incorporated NADA in the BW25113Δ6LDTΔdacA cells not expressing (control) or expressing ldtD, dacA, ldtD and dacA, dacC, ldtD, and dacC, dacD, or ldtD and dacD. The values are mean ± SD of n number of cells.

