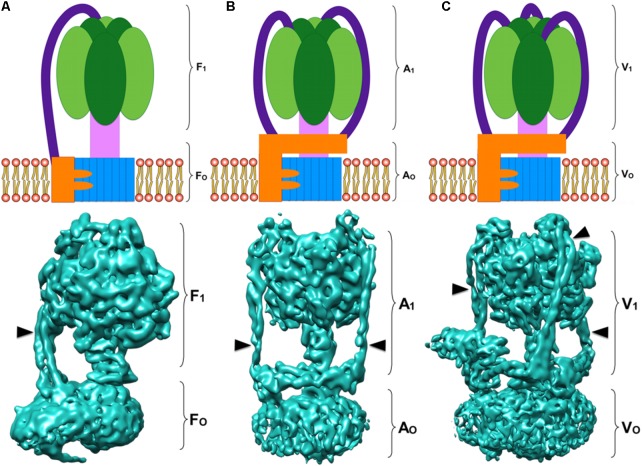
FIGURE 1.
Rotary ATPases. (A) Schematic representation of an F-ATPase (Top) and three dimensional structure of the bovine heart mitochondria F-ATPase (Bottom) (Zhou et al., 2015) EMD 3164. (B) Schematic representation of an A-ATPase (Top) and three dimensional structure of the Thermus thermophilus A-ATPase (Bottom) (Schep et al., 2016) EMD 5335. (C) Schematic representation of a V-ATPase (Top) and three dimensional structure of the Saccharomyces cerevisiae V-ATPase (Bottom) (Zhao et al., 2015) EMD 6285. All the three dimensional maps were generated from electron cryo-microscopy images. The colors in the schematizations represent: catalytic core in dark and light green, central rotor in light pink, c-ring oligomer in blue, subunit a in orange, and peripheral stalks in dark purple. The arrowheads point to the peripheral stalk(s).

