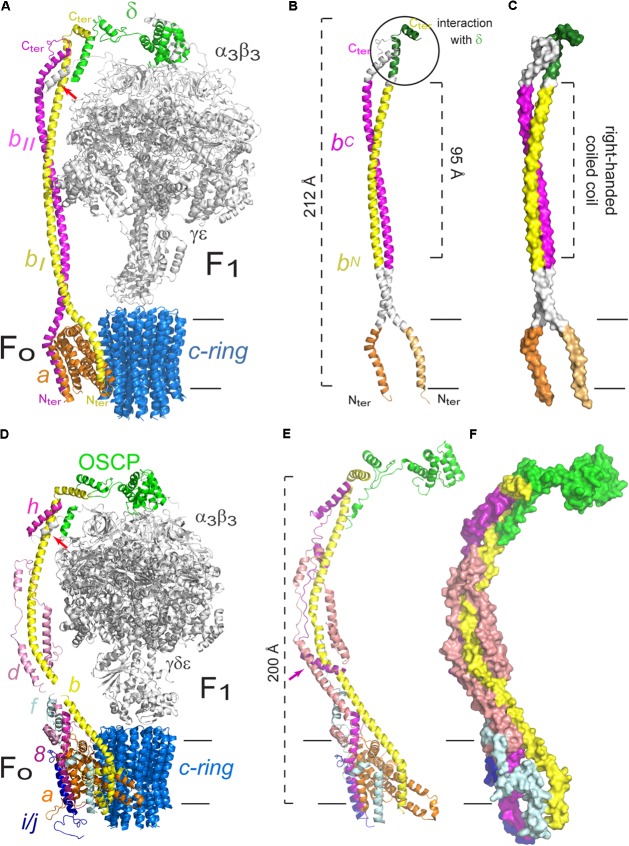
FIGURE 2.
Peripheral stalk of prokaryotic and eukaryotic F-ATPases. (A) Three dimensional model of the enzyme of Escherichia coli in which the peripheral stalk and the FO sector are colored. (B) Model that highlights the different domains of the b2 dimer. The C-terminus (C-ter) and N-terminus (N-ter) of subunit b are indicated. (C) Model to illustrate the right-handed coiled coil domain of the b2 dimer. The model used in A–C corresponds to the structural data deposited with the PDB 5T4O (Sobti et al., 2016). (D) Three dimensional model of the enzyme of Saccharomyces cerevisiae in which the peripheral stalk and the FO sector are colored. The helix of subunit α that contacts b, d and F6 is indicated with a red arrow. (E) Peripheral stalk of the yeast ATPase highlighting its components. The additional helix of subunit h is indicated with a purple arrow. (F) Surface representation to illustrate the coiled coil interactions in the extrinsic part of the yeast peripheral stalk. The model used in D–F corresponds to the structural data deposited with the PDB 6CP6 (Srivastava et al., 2018). The black horizontal lines indicate the mitochondrial inner membrane.

