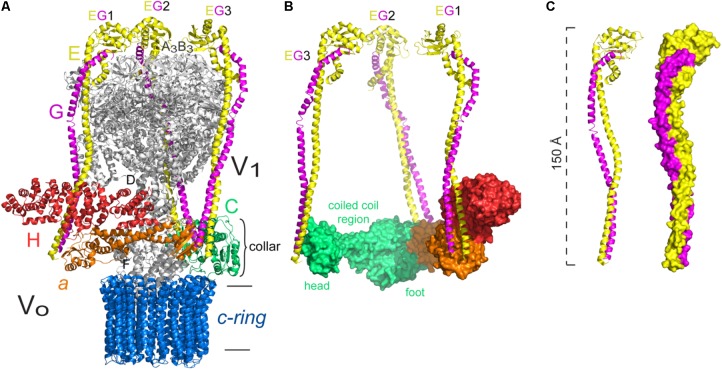
FIGURE 6.
Peripheral stalk of the Saccharomyces cerevisiae V-ATPase. (A) Three dimensional model of the yeast enzyme in which the peripheral stalks and the subunits of the collar-like structure are colored. (B) Model that illustrates the interaction of each peripheral stalk (EG1, EG2, EG3) with the subunits of the collar. The different sections of subunit C are indicated. (C) Models of the EG heterodimer to illustrate the right handed coiling of the helices. The model used in A–C corresponds to structural data deposited with the PDB 3J9V (Zhao et al., 2015). The black horizontal lines indicate the mitochondrial inner membrane.

