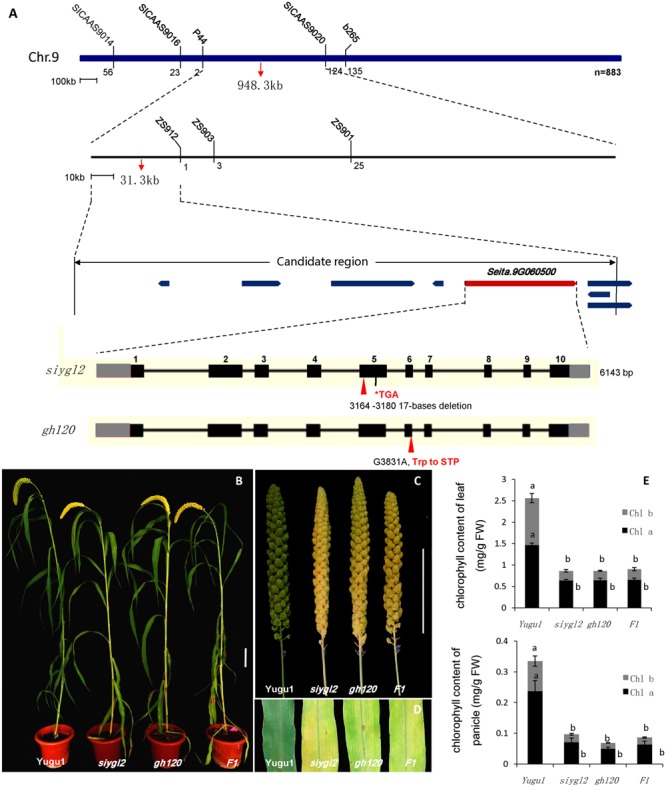
FIGURE 5.

(A) Map-based cloning, gene structure of Seita.9G060500, and the mutant positions of siygl2 and gh120. (B–D) are phenotypes of WT Yugu1 plants and mutants. (E) Chlorophyll content of siygl2, gh120, and F1 individuals. Means and standard deviations are obtained from five independent samples. Values connected by same letters are not statistically different; values not connected by same letters are statistically different at P = 0.05.
