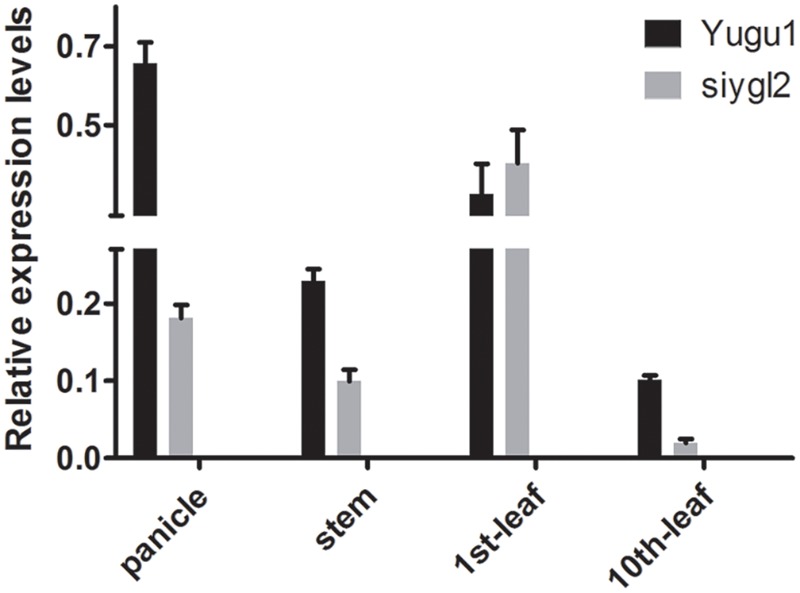
FIGURE 8.

Transcript accumulation of SiYGL2 in panicle, stem, and leaves. Black boxes, Yugu1; gray boxes, siygl2. Means and standard deviations are obtained from three independent samples and three independent assays. Statistics treatment was made with Welch’s two-sample t test. ∗Significantly different at P = 0.05.
