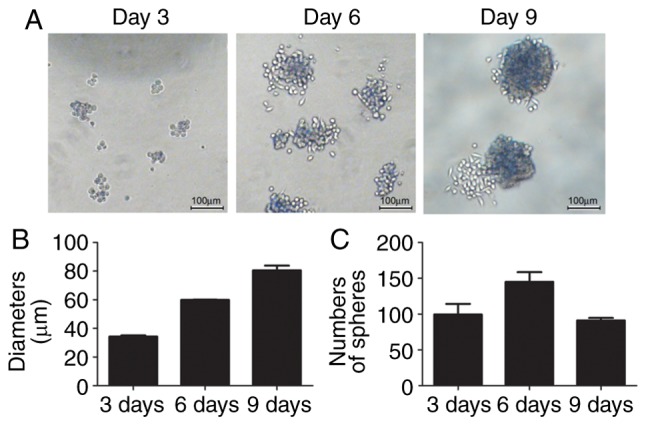
Figure 1.

Suspension sphere formation of HepG2 cells in stem cell conditioned medium. (A) Typical bright-field image of HepG2 cells cultured in stem cell conditioned medium on days 3, 6 and 9. Scale bar, 100 µm. (B) Average diameters of suspended spheres on days 3, 6 and 9. (C) Numbers of spheres on days 3, 6 and 9. Data are expressed as the mean ± standard deviation.
