
Figure 3.
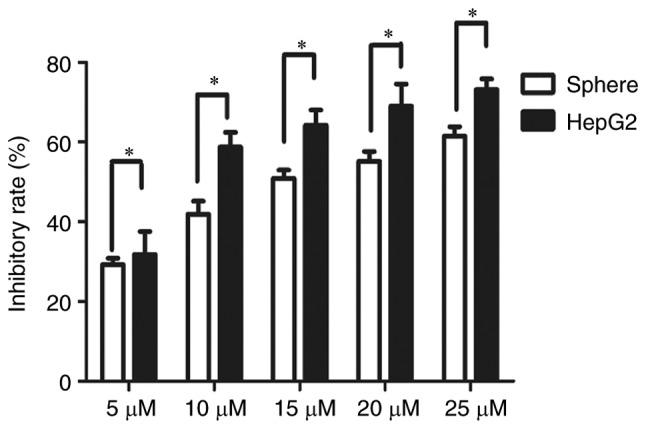
Increased resistance to sorafenib in HepG2 spheres. Spheres were treated with 5, 10, 15, 20 or 25 µM sorafenib for 48 h and the inhibition rate was calculated according to cell viability, as assessed by Cell Counting Kit-8 assay. Each experiment was repeated in triplicate and the data are expressed as the mean ± standard deviation. *P<0.05.