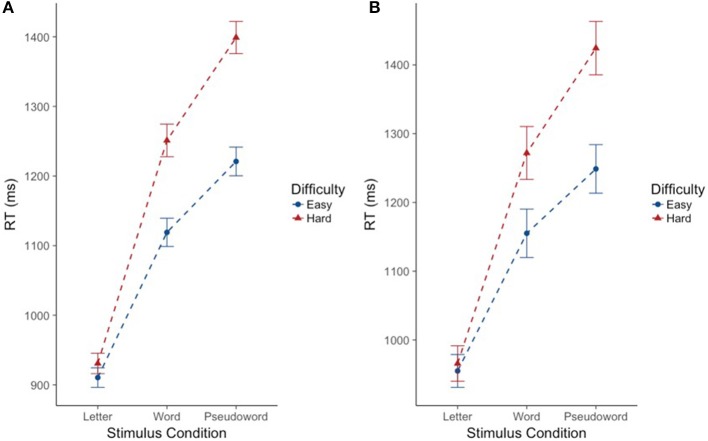
Figure 2.
Effect of degree of difficulty on cross modal reaction time differs for words and pseudowords, but not letters. Reaction time is reported in milliseconds (ms) on the y-axis. Stimulus condition is reported on the x-axis. Difficulty is indicated by color and shape. The “hard” condition is in red triangles. The “easy” condition is in blue circles. Error bars reflect standard error of the mean (SEM). (A) Includes the full sample of participants (n = 224). (B) Includes the subsample of participants (n = 69).

