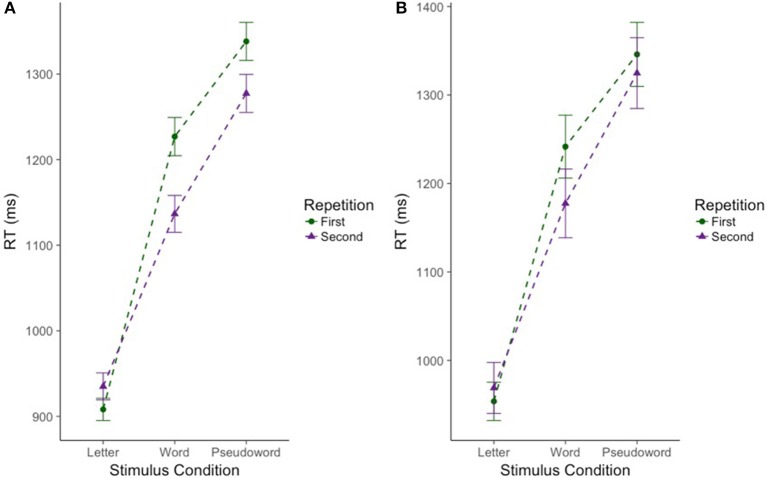
Figure 3.
Effect of repetition on cross modal reaction time differs for words and pseudowords only in the full sample of participants. Reaction time is reported in milliseconds (ms) on the y-axis. Stimulus condition is reported on the x-axis. Repetition is indicated by color and shape. The first presentation of a stimulus is in green circles. The second presentation of a stimulus is in purple triangles. Error bars reflect standard error of the mean (SEM). (A) Includes the full sample of participants (n = 224). (B) Includes the subsample of participants (n = 69).

