
Figure 5.
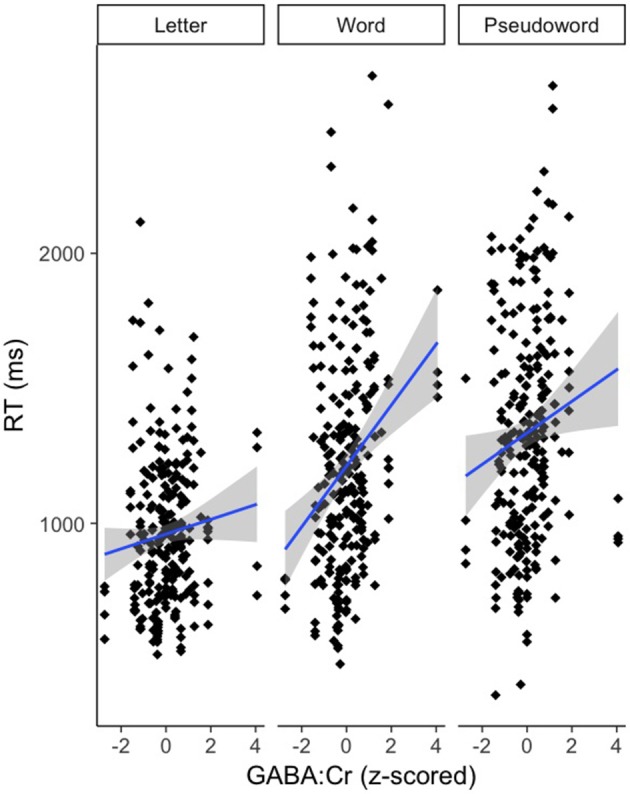
Effect of GABA on cross modal reaction time is driven by the word stimulus condition. Reaction time is reported in milliseconds (ms) on the y-axis. GABA:Cr concentration is reported on the x-axis. Stimulus condition is reported at the top of each panel. The gray area reflects the standard error of the mean (SEM).