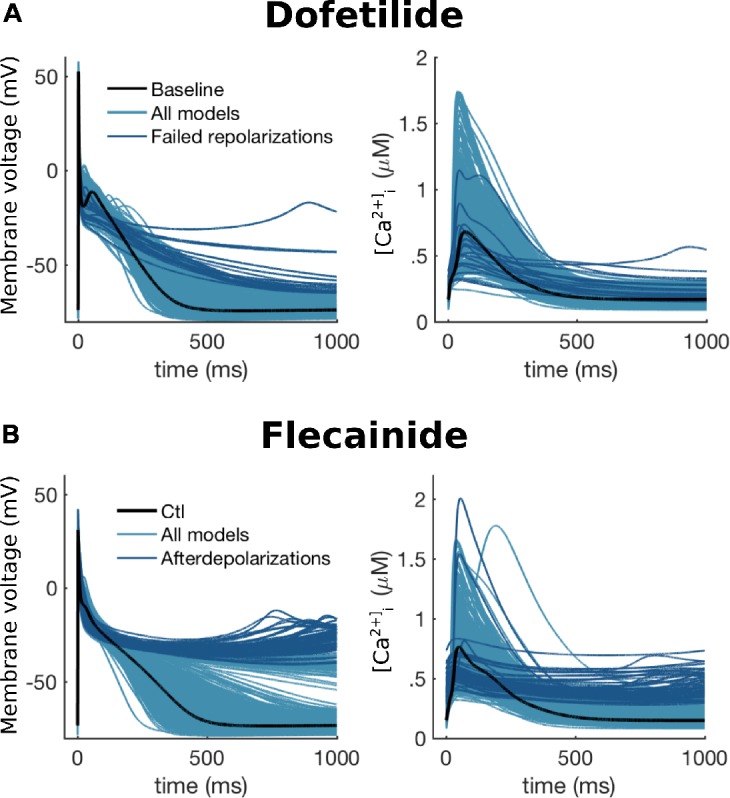
FIGURE 8.

Population of models approach to modeling drug binding effects of dofetilide and flecainide on repolarization abnormalities with an atrial myocyte model. APs (left) and calcium transient (right) traces of dofetilide (A) and flecainide (B) at 10-fold free plasma concentration are shown. Black lines represent the baseline (control) model, light blue traces represent all models in the populations, and dark blue lines show the models that presented repolarization abnormalities. Simulation results were published in preliminary form in abstract at the Vago M. et al. (2017).
