
Figure 4: Dynamic changes in IBD-specific metatranscription over time.
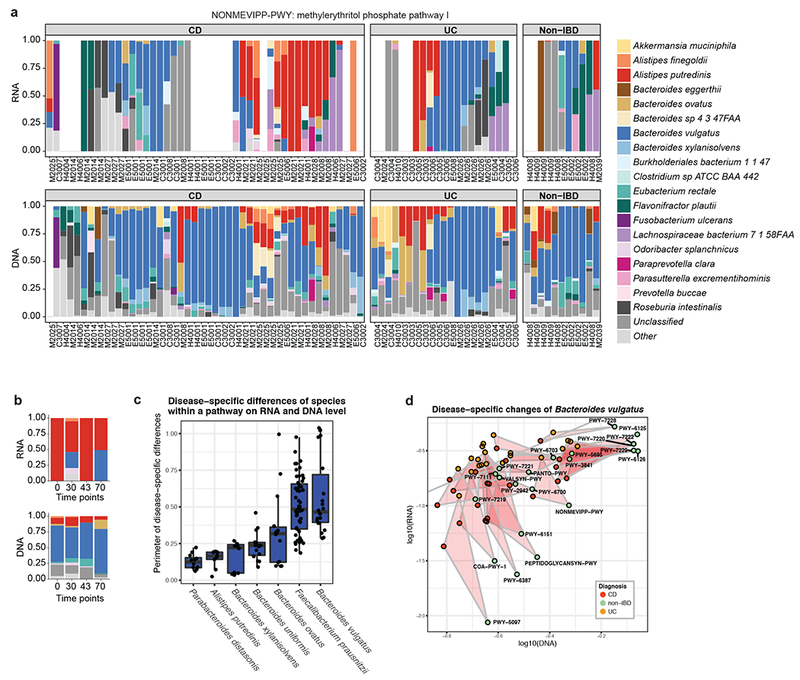
(a) Relative contribution of organisms to the methylerythritol phosphate pathway I (NONMEVIPP-PWY), including all time points and individuals (n=78).. Overtranscription is visible for A. putredinis in the absence of metagenomic disruption. (b) Relative contribution of organisms to the same pathway, restricted to the samples from one CD patient (M2021) over time. A. putredinis consistently over-transcribed this pathway within this individual. Increases in the HBI of this patient were observed at time points 2 and 4, uniquely where pathway transcription was partially contributed by Bacteroides vulgatus. (c) Differences in per-pathway DNA versus RNA contributions of microbial species across disease phenotypes, each point representing the perimeter of the disease-specific pathway triangles described in Fig. 2d+e. The mean, first and third quartiles are displayed. Only pathways detected in at least 20% of metagenomic and metatranscriptomic samples (n=78) were included for a particular species, and only species contributing to at least 8 pathways across samples are displayed. On average, Bacteroides vulgatus exhibited the largest disease-specific difference. (d) Changes in relative contribution of Bacteroides vulgatus to its transcribed pathways stratified by IBD phenotype. For this organism, IBD-specific dysbioses were particularly pronounced on the transcriptional level, with many pathways upregulated both in UC and in CD.