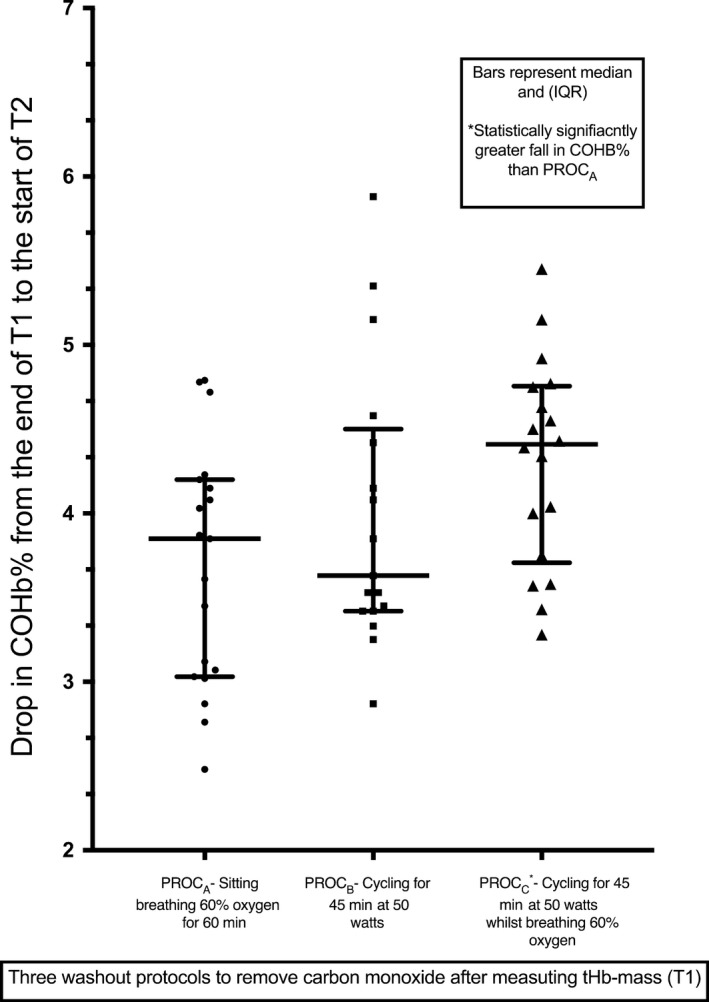
Figure 2.

Comparing the fall in carboxyhemoglobin (COHb%) between test 1 and test 2 of each procedure (T1 and T2). Median with interquartile range shown for each procedure. *Denotes the significant difference between PROC C and PROC A (after multiple comparison correction using the Bonferroni method). COHb, carboxyhemoglobin; PROC A/B/C procedures A/B/C.
