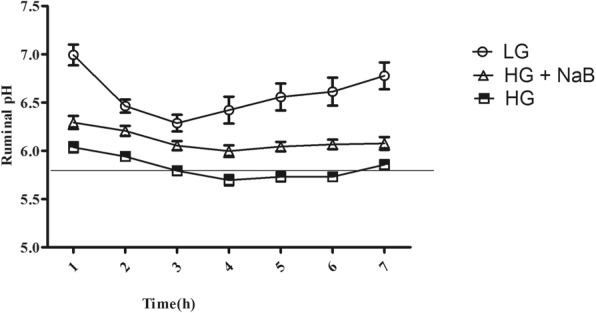
Fig. 1.

Comparison of pH values in ruminal fluid among the low-grain (LG), high-grain (HG) and high-grain with sodium butyrate (HG + NaB) groups. Ruminal fluid samples were collected at times ranging from 0 to 7 h for three consecutive days during the 20th week. Data were analysed by mixed models in SAS (SAS version 9.2, SAS Institute Inc., USA) and are expressed as the mean ± S.E.M. Significant differences were observed at all sampling times (p < 0.05). The error bars indicate the standard error of the mean
