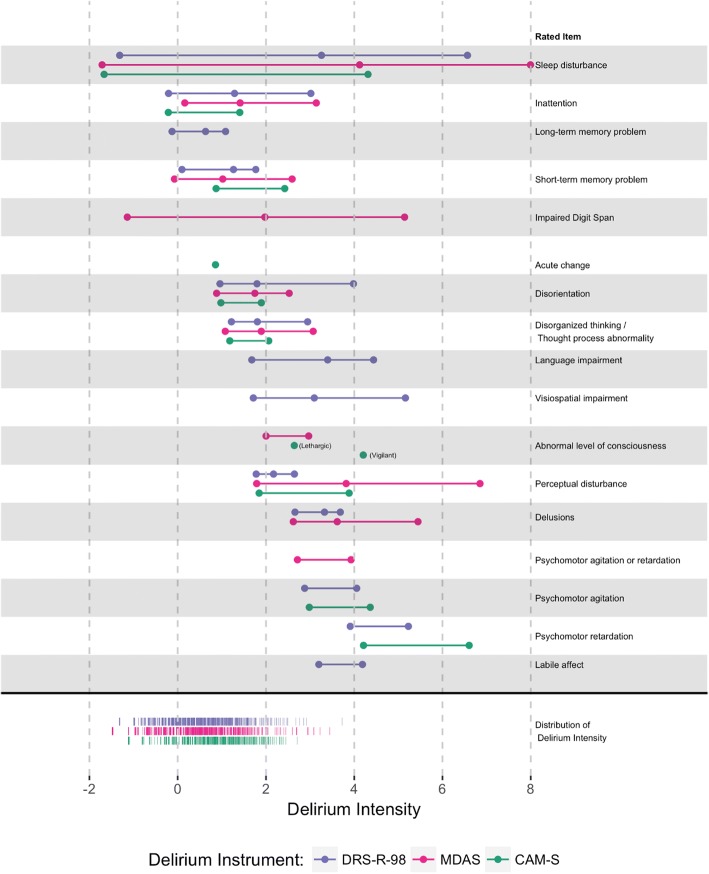
Fig. 2.
Item-person map: Results from the BASIL study (N = 1178 daily observations). Model-estimated item location parameters for each delirium instrument, grouped by rated item, are plotted along the range of delirium intensity. The distribution of delirium intensity scores in the sample is denoted on the bottom of the figure by the purple (DRS-R-98), pink (MDAS), and green (CAM-S) frequency distributions

