
Fig. 5.
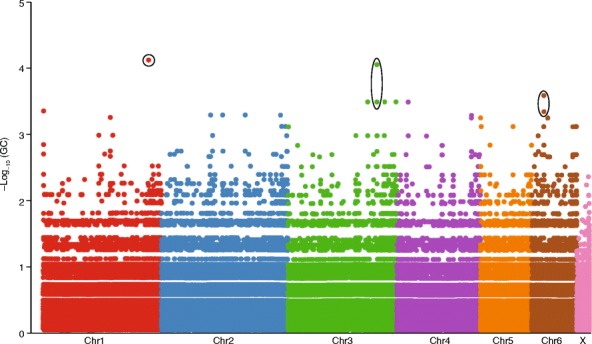
Manhattan plot of adjusted p values of the Tasmanian devil genome-wide association study (GWAS) comparing seven devils that recovered after infection with devil facial tumor disease (DFTD) to six devils that succumbed to the disease. Scaffolds are placed on chromosomes but are unordered. Circles indicate the five candidate SNPs, which are located on three scaffolds. Four of the candidate SNPs (on Chr3 and Chr6) remained significant after including additional samples. Data courtesy of Wright et al. [61]