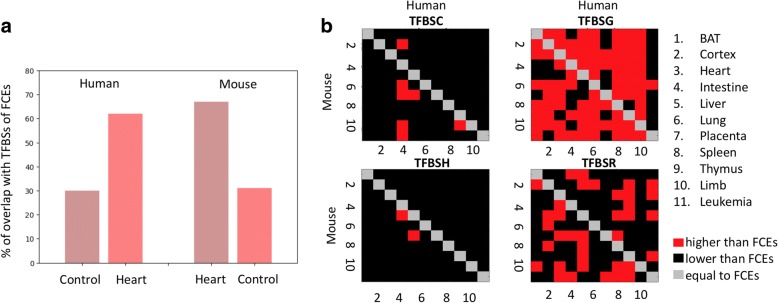
Fig. 4.
TFBS composition of RPEs and FCEs. a. Percentage of TFBSs overrepresented in RPEs, which are also overrepresented in FCEs. Cases for enhancers reprogrammed to mouse tissues and human heart. Controls (liver) are shown for comparison. b. Comparison of TFBS densities for four categories of sites, conserved (TFBSC), gained (TFBSG), reshuffled (TFBSH), and reused (TFBSR), for 110 cases of enhancer reprogramming. The densities of sites were calculated for the four categories of sites of RPEs normalized to densities of sites in FCEs. The diagonal indicates the densities of FCEs since RPEs are not defined for the same tissue in two species. For each plot, the top-right corner corresponds to evolutionary changes between the mouse and human genomes with the human genome as a reference. In the case of the bottom-left corners, the reference is the mouse genome

