Fig. 3.
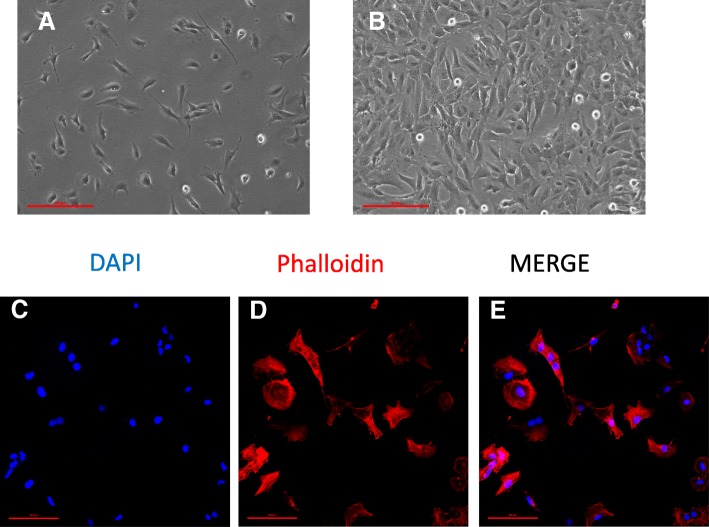
HMC3 cell morphology and labeling of cytoskeletal F-actin filaments. a–b The human microglial cell line HMC3 as it was observed by phase-contrast microscopy at in vitro day 1 (a), and when cells reached the confluency (b). × 10 magnification, scale bar 100 μM. c–e A representative example of confocal images (1024 × 1024 pixels) acquired at × 20 magnification with a confocal laser scanning system (A1+, Nikon). Cells were grown on glass coverslips for 24 h, and their morphology was evaluated by labeling the cytoskeletal F-actin filaments with tetramethylrhodamine (TRITC)-conjugated phalloidin (red fluorescence). Cells were counterstained with the nuclear probe, 4′,6-damidino-2-phenylindole dihydrochloride (DAPI, blue fluorescence). The merged image is shown in (e). Scale bar 50 μM

