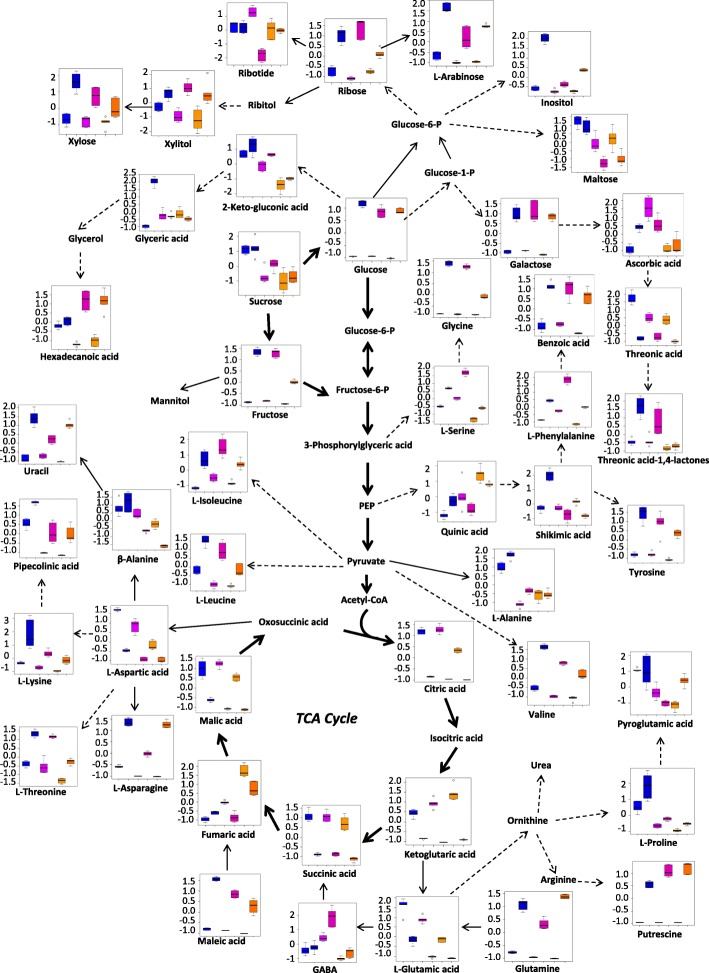
Fig. 6.
Metabolic pathways in leaves of the three barley genotypes in response to low-K stress. The six columns from left to right on the X-axis represent LuDaoMai (control and treatment), XZ141 (control and treatment) and XZ153 (control and treatment), respectively. The concentration of each metabolite on the Y-axis is presented after normalized on Metaboanalyst software (http://www.metaboanalyst.ca/)

